
JAVA-280 · Lesson 7 of 12 · 26 min
JVM memory and garbage collection
▶ Video coming soon A video version of this lesson is on the way.
On Thursday, March 9, Leif told a story from his day job. A service had run perfectly for nine days and then been killed by the kernel at four in the morning, every nine days, for a month. The heap had been fine. What grew was memory outside the heap that nobody had budgeted for, and the container's limit did not care which kind it was. "Lesson 3 gave the booking API 768 megabytes," he said. "Tonight you find out where they go." This lesson looks inside a running JVM's memory, at how the garbage collector frees it, and at what the logs say when it goes wrong.
Where a JVM keeps its memory
The heap holds every object the program creates: each booking, each string, each array. It is the part the garbage collector manages and the part limited by -Xmx or MaxRAMPercentage. But a JVM process uses several other areas, and all of them count against a container's limit.
| Area | What it holds | Limited by |
|---|---|---|
| Heap | Objects created by the program | -Xmx or -XX:MaxRAMPercentage |
| Metaspace | Class metadata: loaded classes, methods, constant pools | -XX:MaxMetaspaceSize (unlimited by default) |
| Code cache | Machine code produced by the JIT compiler | -XX:ReservedCodeCacheSize |
| Thread stacks | One stack per thread for method calls and local variables | -Xss per thread, times the number of threads |
| Direct buffers | Off-heap byte buffers used for network and file input and output | -XX:MaxDirectMemorySize |
| GC data structures | The collector's own bookkeeping | The collector and heap size |
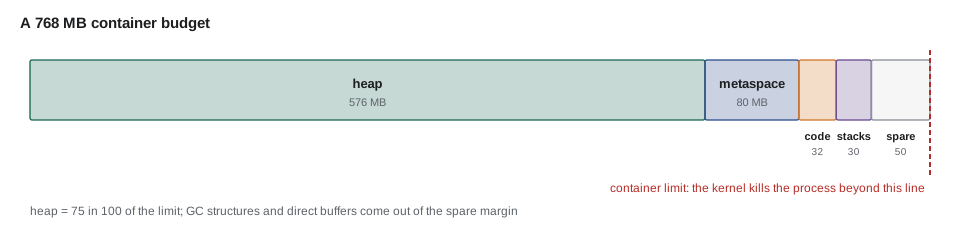
The JVM can account for its own memory with native memory tracking. Hamza ran the small allocation program used later in this lesson with tracking switched on and a 64-megabyte heap. The output below is real, cut down to the summary line of each area.
$ java -Xmx64m -XX:NativeMemoryTracking=summary -XX:+UnlockDiagnosticVMOptions -XX:+PrintNMTStatistics Churn
allocated 195 MB of short-lived arrays, kept 200 blocks
Total: reserved=1535991800, committed=131039224
-                 Java Heap (reserved=67108864, committed=67108864)
-                     Class (reserved=1073840711, committed=229959)
-                    Thread (reserved=15782336, committed=745920)
-                      Code (reserved=253693536, committed=7790176)
-                        GC (reserved=39371471, committed=39371471)
-                    Symbol (reserved=1161006, committed=1161006)
-        Shared class space (reserved=16777216, committed=13221888, readonly=0)
What this code does
Reserved memory is address space set aside; committed memory is what the process actually uses, and it is committed memory that counts against a container's limit. With a 64-megabyte heap, the process committed about 131 megabytes in total, because G1's own structures took another 39 megabytes, the shared class archive 13 and compiled code nearly 8. The class area reserves a gigabyte of address space but commits almost none of it.
In a running service, the same report is available at any time with jcmd PID VM.native_memory summary, if the JVM was started with -XX:NativeMemoryTracking=summary. Leif's nine-day failure, it turned out, had been a library that allocated direct buffers and never released them; tracking showed the Internal and Other areas growing a few megabytes a day.
How garbage collection works
Java programs never free memory themselves. The garbage collector finds objects that the program can no longer reach, starting from roots such as local variables in running methods and static fields, and reuses their memory. Objects reachable from a root are live; everything else is garbage, however recently it was created.
Collectors exploit the generational hypothesis: most objects die young. A booking request creates hundreds of small objects, such as strings, JSON nodes and Optional wrappers, that are garbage when the response is written. So the heap is split into a young generation, where new objects are allocated and collected often and cheaply, and an old generation for objects that survive several young collections, collected rarely. Copying the few survivors out of the young generation is fast precisely because there are few of them.
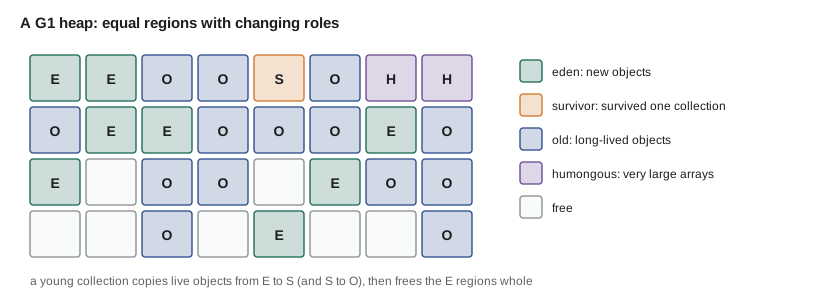
Since Java 9 the default collector on server-class machines, those with at least two processors and about 1.8 gigabytes of memory, is G1, the garbage-first collector. It divides the heap into equal regions, typically 1 to 32 megabytes, each acting as eden, survivor or old space as needed. A young collection pauses the application briefly and copies live objects out of the young regions. When the old generation fills up, G1 marks live objects while the application keeps running and then collects the old regions with the most garbage first, which gives the collector its name. It aims to keep each pause under a goal, 200 milliseconds by default.
| Collector | Flag | Pauses | Suits |
|---|---|---|---|
| Serial | -XX:+UseSerialGC | Stops the application, one thread | Small heaps, one processor |
| Parallel | -XX:+UseParallelGC | Stops the application, many threads | Batch jobs that want throughput |
| G1 | -XX:+UseG1GC (default) | Short, with a pause-time goal | Most services |
| ZGC | -XX:+UseZGC | Under a millisecond, mostly concurrent | Large heaps, strict latency |
| Shenandoah | -XX:+UseShenandoahGC | Very short, mostly concurrent | Large heaps, strict latency |
ZGC does almost all its work while the application runs, keeping pauses under a millisecond even with very large heaps, at the cost of some processor time and memory. Since Java 23 it is generational by default, and the older non-generational mode was removed in Java 24, so -XX:+UseZGC now always means generational ZGC. For the booking API's half-gigabyte heap, G1's pauses of a few milliseconds were already invisible behind network time, and Leif kept the default.
Lesson 3 showed the catch in that default. G1 is chosen only on a server-class machine, and a container with one processor, or with less than about 1.8 gigabytes of memory, is not one, so the JVM picks Serial. The booking API's container has two processors but only 768 megabytes, so it would have run with Serial had Leif not added -XX:+UseG1GC. Serial is not wrong for a small heap, but its pauses stop every thread and grow with the heap, and Leif preferred G1's pause-time goal for a service that answers customers.
Reading a GC log
The JVM's unified logging, switched on with -Xlog, can record every collection. -Xlog:gc gives one line per collection; -Xlog:gc* adds the details of each phase. Hamza ran a small program that allocates two hundred thousand short-lived one-kilobyte arrays and keeps a few larger ones, on a 64-megabyte heap with G1. The output is real.
$ java -Xmx64m -XX:+UseG1GC -Xlog:gc Churn
[0.005s][info][gc] Using G1
[0.036s][info][gc] GC(0) Pause Young (Normal) (G1 Evacuation Pause) 7M->1M(64M) 1.184ms
[0.043s][info][gc] GC(1) Pause Young (Normal) (G1 Evacuation Pause) 16M->2M(64M) 1.421ms
[0.057s][info][gc] GC(2) Pause Young (Normal) (G1 Evacuation Pause) 38M->4M(64M) 2.850ms
[0.065s][info][gc] GC(3) Pause Young (Normal) (G1 Evacuation Pause) 38M->6M(64M) 1.260ms
[0.072s][info][gc] GC(4) Pause Young (Normal) (G1 Evacuation Pause) 39M->8M(64M) 1.356ms
allocated 195 MB of short-lived arrays, kept 200 blocks
What this code does
Each line gives the time since start-up, the collection number, the kind of collection, the heap before and after, the heap's current size in parentheses, and the pause. The young collections took between 1.2 and 2.9 milliseconds and freed most of the young generation each time, because the arrays were already garbage. The heap after each collection grew by about two megabytes, which is the kept blocks moving to old regions.
GC logs are worth keeping in production, written to a file with rotation so that they cannot fill the disk, because they are the first evidence when a service slows down. Leif added this to the booking API's JAVA_TOOL_OPTIONS.
-Xlog:gc*:file=/app/logs/gc.log:time,uptime,level,tags:filecount=5,filesize=10mWhat this code does
gc* logs every GC-related tag at info level, which is detailed but small: a few hundred bytes per collection. The decorators add the wall-clock time and the uptime to each line, so a pause can be matched with a slow request in the application's log. filecount and filesize keep at most five files of ten megabytes, rotating the oldest away.
Reading a long log by eye is slow, and the questions are always the same: how many pauses, how long in total, how long the worst. The example answers them from the lines above.
import java.util.*;
import java.util.regex.*;

public class Main {
    public static void main(String[] args) {
        List<String> log = List.of(
            "[0.005s][info][gc] Using G1",
            "[0.036s][info][gc] GC(0) Pause Young (Normal) (G1 Evacuation Pause) 7M->1M(64M) 1.184ms",
            "[0.043s][info][gc] GC(1) Pause Young (Normal) (G1 Evacuation Pause) 16M->2M(64M) 1.421ms",
            "[0.057s][info][gc] GC(2) Pause Young (Normal) (G1 Evacuation Pause) 38M->4M(64M) 2.850ms",
            "[0.065s][info][gc] GC(3) Pause Young (Normal) (G1 Evacuation Pause) 38M->6M(64M) 1.260ms",
            "[0.072s][info][gc] GC(4) Pause Young (Normal) (G1 Evacuation Pause) 39M->8M(64M) 1.356ms");
        Pattern p = Pattern.compile("GC\\((\\d+)\\) (Pause \\w+).* (\\d+)M->(\\d+)M\\((\\d+)M\\) ([\\d.]+)ms");
        int n = 0, freed = 0;
        double total = 0, worst = 0;
        String worstId = "";
        for (String line : log) {
            Matcher m = p.matcher(line);
            if (!m.find()) continue;
            double ms = Double.parseDouble(m.group(6));
            n++;
            total += ms;
            freed += Integer.parseInt(m.group(3)) - Integer.parseInt(m.group(4));
            if (ms > worst) { worst = ms; worstId = "GC(" + m.group(1) + ")"; }
        }
        System.out.printf("%d pauses, %.3f ms in total, worst %s at %.3f ms%n", n, total, worstId, worst);
        System.out.printf("mean pause %.3f ms; %d MB freed%n", total / n, freed);
    }
}5 pauses, 8.071 ms in total, worst GC(2) at 2.850 ms mean pause 1.614 ms; 117 MB freed
What this code does
The regular expression captures the collection number, the kind of pause, the heap before and after, the heap size and the pause time, and lines that are not collections, such as Using G1, are skipped. The totals show that five collections paused the program for about eight milliseconds in all and freed 117 megabytes. Real tools such as GCViewer do the same with charts, but the questions they answer are these.
When memory runs out
An OutOfMemoryError means the JVM could not satisfy an allocation. The message after the colon says which area ran out, and each has a different cause.
| Message | Usual cause | First step |
|---|---|---|
| Java heap space | Too many live objects: a leak or a heap too small for the load | Take a heap dump and look for what holds the objects |
| GC overhead limit exceeded | The heap is almost full and collections free almost nothing | Same as heap space |
| Metaspace | Too many classes, often from repeated redeployment or generated classes | Count loaded classes over time |
| unable to create native thread | Too many threads for the process or container limit | Count threads; use pools or virtual threads |
| Direct buffer memory | Off-heap buffers not released | Native memory tracking; check the library |
There is a fifth way to run out that produces no Java error at all: the process uses more memory than its container's limit, and the kernel kills it. Docker reports such a container as OOMKilled with exit code 137, and the JVM's log just stops. That was Leif's nine-day failure, and the defense is the budget from lesson 3: heap plus everything else must fit under the limit with a margin.
To see a heap leak, Hamza ran a program that adds strings to a static list and never removes them, the shape of a cache that is never cleared, on a deliberately tiny 16-megabyte heap. The run is real.
$ java -Xmx16m -XX:+HeapDumpOnOutOfMemoryError -XX:HeapDumpPath=leak.hprof Leak
cached 0
cached 20000
cached 40000
java.lang.OutOfMemoryError: Java heap space
Dumping heap to leak.hprof ...
Heap dump file created [19466296 bytes in 0.015 secs]

Exception: java.lang.OutOfMemoryError thrown from the UncaughtExceptionHandler in thread "main"
What this code does
The list grew to over forty thousand entries before the heap was full, and the JVM threw OutOfMemoryError with the message Java heap space. Because of -XX:+HeapDumpOnOutOfMemoryError, it first wrote the whole heap to leak.hprof, about nineteen megabytes, which a tool such as Eclipse MAT or VisualVM can open to show which object holds the most memory. The last line comes from the uncaught error in main, after the dump.
In a container, the dump must go to a volume, or it disappears with the container. Leif's production flags wrote dumps to /app/dumps on a mounted volume and added -XX:+ExitOnOutOfMemoryError, from lesson 3, so that a JVM in an unknown state exits at once and Compose restarts it, instead of limping on.
The leak's fix is to give the cache a size. A LinkedHashMap kept in access order, with removeEldestEntry overridden, is a complete least-recently-used cache in a few lines.
import java.util.*;

public class Main {
    static <K, V> Map<K, V> lru(int capacity) {
        return new LinkedHashMap<>(16, 0.75f, true) {
            @Override
            protected boolean removeEldestEntry(Map.Entry<K, V> eldest) {
                return size() > capacity;
            }
        };
    }

    public static void main(String[] args) {
        Map<Integer, String> cache = lru(1000);
        for (int i = 0; i < 50_000; i++) {
            cache.put(i, "booking " + i + " " + "x".repeat(200));
            if (i % 10_000 == 0) cache.get(0);
        }
        System.out.println("entries kept: " + cache.size());
        System.out.println("still cached: 0? " + cache.containsKey(0) + ", 49999? " + cache.containsKey(49_999) + ", 25000? " + cache.containsKey(25_000));
    }
}entries kept: 1000 still cached: 0? false, 49999? true, 25000? false
What this code does
The third constructor argument, true, orders entries by last access instead of insertion, and removeEldestEntry is called after every put, removing the least recently used entry once the map exceeds its capacity. After fifty thousand puts the cache holds exactly one thousand entries, so memory stays flat. Entry 0 was last read when the loop reached 40,000, so it was evicted later on like any other old entry, while the newest entry is still cached.
In the booking API, caches are configured through Spring's cache abstraction with Caffeine, which adds expiry by time as well as by size, but the rule is the same: every cache needs a bound.
Smaller objects
Every Java object starts with a header that the JVM uses for locking, hashing and garbage collection, and that points to the object's class. On a 64-bit JVM with compressed class pointers, the header is 12 bytes, and objects are padded to a multiple of 8 bytes. For small objects the header is a large share of the size. Compact object headers, JEP 519, a product feature since Java 25, shrink the header to 8 bytes; they are switched on with -XX:+UseCompactObjectHeaders and are not yet the default. The example estimates the saving for the shop's small records.
public class Main {
    static long size(int header, int fieldBytes) {
        long raw = header + fieldBytes;
        return (raw + 7) / 8 * 8;
    }

    public static void main(String[] args) {
        String[] names = {"Slot (LocalDate ref, LocalTime ref)", "Money (long cents)", "Tally (three int fields)"};
        int[] fields = {8, 8, 12};
        long count = 200_000;
        for (int i = 0; i < names.length; i++) {
            long before = size(12, fields[i]), after = size(8, fields[i]);
            System.out.printf("%-36s %2d -> %2d bytes, %,d objects: %,d KB saved%n",
                names[i], before, after, count, (before - after) * count / 1024);
        }
    }
}Slot (LocalDate ref, LocalTime ref) 24 -> 16 bytes, 200,000 objects: 1,562 KB saved Money (long cents) 24 -> 16 bytes, 200,000 objects: 1,562 KB saved Tally (three int fields) 24 -> 24 bytes, 200,000 objects: 0 KB saved
What this code does
size adds the header to the fields and rounds up to the next multiple of 8 with integer arithmetic. References are 4 bytes each with compressed pointers, so a record of two references has 8 bytes of fields. Records of 8 bytes of fields shrink from 24 to 16 bytes, a third smaller, while the record with 12 bytes of fields needs 24 bytes either way, because 20 still rounds up to 24, so the real saving depends on each class's layout.
Leif's view was that, since the booking API's image already ran Java 25, this was a cheap improvement to try once it was in production: measure the heap after a day with the flag and without, and keep it if nothing else changed.
Exercises
Try it yourself
Read one GC line
Complete describe so that for a line such as GC(2) Pause Young (Normal) (G1 Evacuation Pause) 38M->4M(64M) 2.850ms it returns GC(2): 34 MB freed in 2.850 ms. Lines without -> return not a collection.
You may use split and indexOf instead of a regular expression.
public class Main {
    static String describe(String line) {
        return line;
    }

    public static void main(String[] args) {
        System.out.println(describe("GC(2) Pause Young (Normal) (G1 Evacuation Pause) 38M->4M(64M) 2.850ms"));
        System.out.println(describe("GC(7) Pause Young (Mixed) (G1 Evacuation Pause) 51M->22M(64M) 4.012ms"));
        System.out.println(describe("Using G1"));
    }
}
Try it yourself
Bound the cache
Complete BoundedCache.put so that the cache never holds more than capacity entries: when a new key would exceed it, remove the entry that was inserted first. (This is insertion order, not access order.)
import java.util.*;

public class Main {
    static class BoundedCache {
        private final int capacity;
        private final LinkedHashMap<String, Integer> map = new LinkedHashMap<>();
        BoundedCache(int capacity) { this.capacity = capacity; }

        void put(String key, int value) {
            map.put(key, value);
        }

        public String toString() { return map.toString(); }
    }

    public static void main(String[] args) {
        BoundedCache c = new BoundedCache(3);
        for (String k : List.of("TUBE-700x25", "BELL", "CHAIN-11", "PAD-ROAD", "BELL", "GRIPS")) {
            c.put(k, k.length());
            System.out.println(c);
        }
    }
}
Before leaving, Hamza wrote the booking API's memory budget into the repository's docs folder: 768 megabytes for the container, 576 for the heap, two processors and G1 chosen explicitly, GC logs rotated, heap dumps on a volume and exit on OutOfMemoryError. Leif added one line at the bottom: check native memory after a week in production.
Common mistakes
MistakeSizing the container by the heap alone.
InsteadBudget for metaspace, code cache, thread stacks, direct buffers and GC structures as well, with a margin.
MistakeExpecting G1 in a container with less than about 1.8 GB of memory.
InsteadChoose the collector explicitly with -XX:+UseG1GC, or accept Serial knowingly.
MistakeRunning production without GC logs.
InsteadLog with -Xlog:gc* to a rotated file so the first evidence is already there.
MistakeLetting a JVM continue after OutOfMemoryError.
InsteadUse ExitOnOutOfMemoryError and let the platform restart it, after writing a heap dump to a volume.
MistakeWriting a cache without a size limit.
InsteadBound every cache by size, and by time where it makes sense.
Summary and key terms
- A JVM uses memory for the heap and also for metaspace, the code cache, thread stacks, direct buffers and the collector's own structures, and all of it counts against a container's limit; native memory tracking shows the split.
- The garbage collector frees objects unreachable from roots and relies on most objects dying young, collecting a young generation often and an old generation rarely.
- G1, the default on server-class machines with two or more processors and about 1.8 GB of memory, divides the heap into regions and aims for short pauses; Serial suits one processor, Parallel throughput, and ZGC, generational since Java 23, sub-millisecond pauses.
- Unified logging with -Xlog:gc records each collection and should be rotated to a file in production.
- OutOfMemoryError messages name the exhausted area, a container over its limit is killed with exit code 137, heap dumps reveal leaks, and every cache needs a bound.
- Compact object headers in Java 25 reduce object headers from 12 to 8 bytes.
- Heap
- The memory area where Java objects live, managed by the garbage collector.
- Metaspace
- Native memory holding class metadata.
- Garbage collector
- The part of the JVM that frees memory used by unreachable objects.
- Generational hypothesis
- The observation that most objects die young.
- G1
- The default region-based collector with a pause-time goal.
- ZGC
- A mostly concurrent collector with sub-millisecond pauses.
- Unified logging
- The JVM logging system controlled by -Xlog.
- Heap dump
- A file containing every object in the heap, for leak analysis.
- Native memory tracking
- JVM accounting of memory used outside and inside the heap.
- Compact object headers
- A Java 25 option that shrinks object headers to 8 bytes.
Practice problems
Work each problem on paper first, then reveal the answer to check.
Which kind of memory counts against a container's limit?
Show answer
Committed memory of every area, not only the heap.
Why are young collections cheap?
Show answer
Most young objects are already garbage, so few survivors need copying.
What does exit code 137 on a container usually mean?
Show answer
The kernel killed it for exceeding its memory limit.
Which flag writes a heap dump when the heap runs out?
Show answer
-XX:+HeapDumpOnOutOfMemoryError.
What makes a LinkedHashMap evict entries?
Show answer
Overriding removeEldestEntry to return true when the size exceeds the capacity.
Lesson quiz · 5 questions
Score 60% or more to complete this lesson.
Create a free account to save your progress, take quizzes and earn a certificate.