
HSE-401 · Lesson 11 of 12 · 20 min
Measuring safety culture
A year after the spiral conveyor injury, the board of Harrowgate Foods Ltd. asked Rachel a reasonable question: 'Is the culture actually better, and how do you know?' Rachel could point to a long list of activities: leader walk-arounds, learning teams, new recognition, life-saving rules, the redesigned bonus. Elena could show that reports had risen and recordable injuries had fallen at the plant. But the board wanted to know whether the way people thought and behaved had changed, not just whether leaders had been busy. This lesson is about how to answer that question honestly.
Culture is hard to measure because its deepest level, the basic assumptions, is not directly visible. No single method captures it. The best approach combines several methods, each of which sees part of the picture, and looks for patterns where they agree and disagree.
What to measure, and why
Before choosing methods, it helps to be clear about the purpose. Organizations measure safety culture for several reasons: to find a starting point, to identify where to focus, to see whether changes are working, and to compare sites, shifts and departments. The purpose shapes the method. A company-wide baseline might use a broad survey. Understanding why one shift differs might need interviews and observation.
It also helps to be clear about the difference between activity measures, such as the number of walk-arounds or learning teams, and outcome measures, such as what workers experience and how they behave. Lesson 3 noted that behaviour logs count activity. Culture measurement should mainly look at outcomes: whether people now believe it is safe and worthwhile to report, whether leaders' actions match their words, and whether work is actually done more safely.
Perception surveys
Safety climate surveys are the most common tool. Workers answer statements on a scale, usually anonymously, about topics such as management commitment, supervisor support, reporting, rules and procedures, training, communication, involvement and work pressure. Well-known validated instruments include the Nordic Safety Climate Questionnaire, developed by researchers in the Nordic countries and available in many languages, and several surveys used by national safety organizations and universities. Using a validated survey means the questions have been tested to measure what they claim to, and results can be compared with other organizations.
Good survey practice includes:
- Anonymity and trust: results reported only for groups large enough that individuals cannot be identified, often a minimum of 5 to 10 responses per group, and a clear explanation of who sees what.
- Inclusion: paper and online versions, translated questionnaires, time on shift to complete it, and deliberate effort to reach night shift, temporary and agency workers.
- Comparison by group: results broken down by site, department, shift and level, because the differences are often more important than the averages.
- Repeat measurement: the same questions every 12 to 24 months to see change, with pulse surveys in between.
- Feedback: sharing the results with everyone who took part, and saying what will be done, quickly. A survey with no visible follow-up damages trust and lowers response rates next time.
Surveys have limits. They measure climate more than culture. People may give socially desirable answers, especially if they doubt anonymity. Response rates can be low in exactly the groups where trust is weakest. And a score on its own says little about why people feel the way they do.
Interviews and focus groups
Interviews and focus groups go deeper than surveys. They let people explain their answers, tell stories and describe the assumptions behind behaviour. Questions are open: 'Tell me about a time you felt you had to choose between getting the job done and doing it safely.' 'What happened the last time someone stopped a job here?' 'What does a new worker need to learn that is not in the training?'
Stories are particularly revealing. The stories people tell about past events, such as the supervisor who was disciplined for stopping a line, or the manager who came in at 3:00 a.m. after a near miss, are how culture is passed on. When the stories change, the culture is changing. Elena started listening for whether new stories about the spiral conveyor, the freezer line decision and the distribution centre bonus were being told on the floor.
Interviews and focus groups should be run by someone the participants trust, often an outside facilitator or a joint occupational health and safety committee member, with no supervisors present, and with a clear explanation of how the information will be used.
Observation
Observation looks directly at behaviour and conditions: how jobs are actually done, how meetings are run, how leaders respond to reports and how people interact. Methods range from structured behaviour observations, where trained observers watch tasks and record safe and at-risk behaviours against a checklist, to less structured observation of meetings and shift handovers. Leader walk-arounds, covered in lesson 4, are also a form of observation.
Behaviour-based safety programs, which became popular from the 1980s, use peer observation and feedback to encourage safe behaviours. When run well, with workers in control of the program and a focus on fixing the conditions behind at-risk behaviours, they can produce useful data and conversations. When run badly, as a way of catching and blaming workers, they damage trust and miss the system causes. Observation data should always be used to ask why, not to assign blame.
Records and indicators
Existing records also reveal culture. Useful indicators include:
- the number and quality of hazard and near miss reports, and their ratio to injuries (lesson 7);
- the time taken to close corrective actions and to give feedback to the person who reported;
- the share of corrective actions that are engineering changes rather than retraining;
- the number of stop-work events, and what happened after each;
- participation in the joint occupational health and safety committee, learning teams and safety activities, by shift and site;
- the results of critical control verifications (lesson 9);
- the timing of injury reports, and workers' compensation claims without internal reports.
No single indicator tells the whole story, and any indicator that is turned into a target can be gamed. A site told to raise its near miss count can generate trivial reports. That is why indicators should be read together and interpreted with the people who generate them.
Triangulation
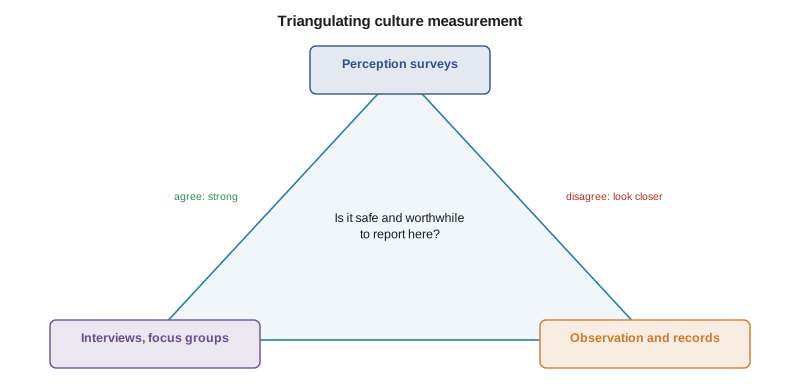
The most reliable picture comes from triangulation: comparing what several methods say about the same question. If surveys say reporting is safe, interviews tell stories of people being thanked for reports, and records show reports rising and being closed quickly, the conclusion is strong. If surveys say reporting is safe but interviews reveal fear and records show few reports from one shift, something is wrong, and the disagreement itself tells you where to look.
Rachel's one-year review
Elena repeated the survey from lesson 1, this time using a validated instrument with more items, at all three sites, and compared five key dimensions with the baseline. She also ran six focus groups and pulled the main record indicators.
# Climate survey: mean score out of 5 on five dimensions, baseline vs one year later,
# for front-line workers at each site, plus the manager-worker gap at the main plant.
dims = ["Management commitment", "Reporting is safe", "Supervisor support",
        "Procedures match work", "Concerns acted on"]
data = {
    "Main plant": ([3.1, 2.8, 3.3, 2.6, 2.7], [3.7, 3.6, 3.8, 3.1, 3.5]),
    "Distribution": ([3.0, 2.5, 3.0, 2.9, 2.6], [3.6, 3.5, 3.4, 3.2, 3.4]),
    "Sauces plant": ([3.4, 3.2, 3.5, 3.1, 3.0], [3.5, 3.3, 3.4, 3.2, 3.1]),
}
for site, (before, after) in data.items():
    change = [a - b for a, b in zip(after, before)]
    print(f"{site}: average change {sum(change)/len(change):+.2f}")
    for d, b, a in zip(dims, before, after):
        print(f"   {d:<22} {b:.1f} -> {a:.1f} ({a-b:+.1f})")
mgr_before, mgr_after = 4.4, 4.2
print(f"Main plant manager-worker gap: {mgr_before - sum(data['Main plant'][0])/5:.2f} -> "
f"{mgr_after - sum(data['Main plant'][1])/5:.2f}")Main plant: average change +0.64 Management commitment 3.1 -> 3.7 (+0.6) Reporting is safe 2.8 -> 3.6 (+0.8) Supervisor support 3.3 -> 3.8 (+0.5) Procedures match work 2.6 -> 3.1 (+0.5) Concerns acted on 2.7 -> 3.5 (+0.8) Distribution: average change +0.62 Management commitment 3.0 -> 3.6 (+0.6) Reporting is safe 2.5 -> 3.5 (+1.0) Supervisor support 3.0 -> 3.4 (+0.4) Procedures match work 2.9 -> 3.2 (+0.3) Concerns acted on 2.6 -> 3.4 (+0.8) Sauces plant: average change +0.06 Management commitment 3.4 -> 3.5 (+0.1) Reporting is safe 3.2 -> 3.3 (+0.1) Supervisor support 3.5 -> 3.4 (-0.1) Procedures match work 3.1 -> 3.2 (+0.1) Concerns acted on 3.0 -> 3.1 (+0.1) Main plant manager-worker gap: 1.50 -> 0.66
The survey showed clear improvement at the main plant and the distribution centre, especially on whether reporting is safe and whether concerns are acted on, and almost no change at the Kentville sauces plant. The perception gap between managers and workers at the main plant had narrowed from about 1.5 points to about 0.7, partly because workers' scores rose and partly because managers had become more realistic.
The focus groups explained the results. At the main plant and the distribution centre, people told new stories: the infeed delay, the redesigned bonus, Marcus at 2:00 a.m. At Kentville, people said they had heard about the changes but had not seen them, because the plant manager had been on extended leave and the move to twelve-hour shifts had absorbed everyone's attention. Records agreed: Kentville had the lowest rate of walk-arounds and learning teams. The triangulated picture told Rachel exactly where to focus in the second year.
The 'procedures match work' dimension improved least everywhere. Focus groups said that learning teams had fixed the tasks they looked at, but that most procedures were still written in the office. That pointed to the next step: a program of reviewing procedures with the people who use them.
Reporting culture measurement to leaders
When Rachel presented the review to the board, she avoided a single culture score. Instead, she showed the triangulated picture for each site, the strengths and gaps, the stories that illustrated them, and the three priorities for the next year. She also told the board what she did not know: the survey response rate among agency workers had been only 31 percent, so their views were under-represented. Honest reporting about the limits of the data, including what is not known, is itself part of a strong safety culture.
In Nova Scotia, the joint occupational health and safety committee has a legal role in monitoring the safety program under Nova Scotia's Occupational Health and Safety Act. Involving committee members in designing surveys, running focus groups and interpreting results gives the measurement credibility with workers and helps the committee do its job.
Worked problem
Investigating a disagreement between methods
Show solution
- The survey shows night shift at the main plant rating 'reporting is safe' at 3.9, higher than day shift.
- But records show night shift submitted only a third as many near miss reports per worker as day shift.
- Focus groups with night workers explain: they feel safe reporting to their new supervisor, but the reporting app needs a login that night workers were never given, and paper cards run out.
- The disagreement was not about culture but about access. Night workers are given logins and the card boxes are restocked on each shift.
- Three months later, night shift reporting per worker matches day shift.
Answer: When methods disagree, the gap points to a specific, often fixable, cause.
Measuring leaders' safety behaviour
Some organizations also ask workers to rate their own supervisor's safety behaviours directly, using short anonymous questionnaires about whether the supervisor discusses safety, acts on concerns, backs people who stop work and applies rules fairly. Research on supervisor safety climate has linked these ratings to injury outcomes. At Harrowgate Foods Ltd., supervisors received their own team's anonymous results each year, compared with the site average, and discussed them with their manager and a coach. Elena found that this was one of the most powerful levers in the whole program: most supervisors genuinely wanted to be seen as fair and caring, and seeing their crew's view in black and white prompted changes that no training course had achieved.
Common mistakes
MistakeMeasuring culture with one survey score.
InsteadCombine surveys, interviews, observation and records, and compare them.
MistakeCounting leader activities as proof that culture has changed.
InsteadMeasure outcomes: what workers experience and how work is actually done.
MistakeRunning a survey without visible follow-up.
InsteadShare results quickly and say what will be done, or trust and response rates fall.
MistakeTurning indicators into targets.
InsteadRead indicators together and interpret them with the people who generate them.
MistakeHiding the limits of the data.
InsteadSay what you do not know, such as low response rates from agency workers.
Summary and key terms
- Culture is hard to measure directly; use several methods and look for patterns.
- Validated perception surveys measure climate; protect anonymity, include everyone, break results down by group, repeat and give feedback.
- Interviews, focus groups and stories reveal the assumptions behind behaviour; new stories signal cultural change.
- Observation should be used to ask why, never to catch and blame.
- Records such as reporting ratios, closure times, stop-work events and control verifications are useful indicators but can be gamed if made targets.
- Triangulation strengthens conclusions where methods agree and points to specific causes where they disagree.
- Perception survey
- A questionnaire that measures how people view safety in their workplace.
- Validated instrument
- A survey whose questions have been tested to measure what they claim to measure.
- Focus group
- A facilitated discussion with a small group to explore views and experiences in depth.
- Behaviour-based safety
- A program using observation and feedback on behaviours to encourage safe work.
- Triangulation
- Comparing several methods to check and strengthen conclusions.
- Pulse survey
- A short, frequent survey used between full surveys to track change.
Practice problems
Work each problem on paper first, then reveal the answer to check.
Why is safety culture hard to measure directly?
Show answer
Its deepest level, the basic assumptions, is not directly visible; surveys mostly measure climate.
List four elements of good survey practice.
Show answer
Any four: anonymity with minimum group sizes, inclusion of all groups and languages, results by group, repeat measurement, visible feedback and action.
What is triangulation and why is it useful?
Show answer
Comparing several methods on the same question; agreement strengthens conclusions and disagreement shows where to look.
What did the one-year review find at the sauces plant, and why?
Show answer
Almost no change, because the plant manager was on leave and the shift change absorbed attention, so few leadership activities had reached it.
Why did Rachel tell the board about the low agency worker response rate?
Show answer
Honest reporting of data limits is part of a strong safety culture, and agency workers' views were under-represented.
Lesson quiz · 5 questions
Score 60% or more to complete this lesson.
Create a free account to save your progress, take quizzes and earn a certificate.