
HSE-241 · Lesson 4 of 12 · 30 min
Measuring noise: instruments and surveys
You cannot manage what you have not measured. A hearing conservation program depends on knowing which areas are noisy, which workers are exposed and by how much, which sources dominate, and whether controls are working. Measurements answer those questions, but only if they are planned for a purpose, taken with suitable instruments, and interpreted by someone who understands their limits. This lesson covers the instruments, the main types of noise survey and the practical steps that make measurements trustworthy. Lesson 5 then shows how the results are turned into a daily exposure.
Why measure?
Noise measurements are taken for different reasons, and each reason calls for a different approach.
| Purpose | Question answered | Usual method |
|---|---|---|
| Screening | Is there likely to be a noise problem here at all? | A quick walk-through with a sound level meter, or the simple test of needing to shout at arm's length |
| Area survey and noise map | Where are the noisy areas, and which need posting? | Sound level meter readings on a grid or at workstations |
| Exposure assessment | What daily exposure does each worker or job group receive? | Personal dosimetry or task-based measurements combined with time studies |
| Source identification | Which machines and components produce the noise? | Measurements close to sources, switch-off tests, octave band analysis |
| Control evaluation | Did the enclosure, silencer or new machine work? | Before-and-after measurements under the same conditions |
| Protector selection | What attenuation is needed, and at which frequencies? | A-weighted and C-weighted levels or octave band data at the worker |
| Purchasing | Will a new machine meet the buy-quiet target? | Manufacturer declared emission data and acceptance testing |
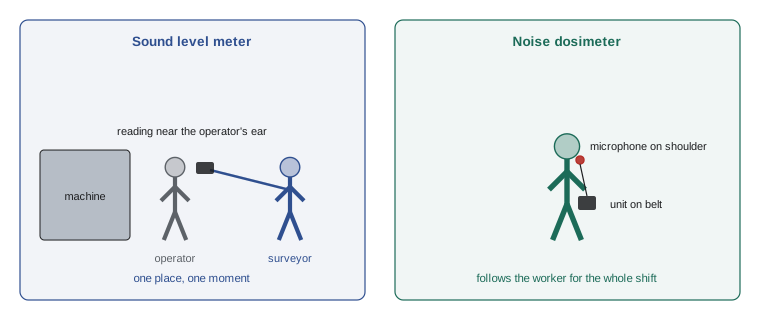
A common error is to use one kind of measurement for a purpose it cannot serve. A single sound level meter reading at a machine is useful for a noise map, but it says little about the daily exposure of a mechanic who spends ten minutes there and the rest of the day elsewhere. Conversely, a dosimeter result tells you a worker's dose but not which machine to fix.
Screening
Before calling in instruments, a simple rule of thumb helps decide whether a full assessment is needed. If people standing about one metre apart have to raise their voices to be understood, the level is probably 85 dBA or more. If they have to shout, it is probably above 90 dBA. Other signs are ringing ears or muffled hearing at the end of a shift, and machinery known to be noisy, such as grinders, saws, impact tools, presses, compressors and chippers. Any of these signs means a proper assessment should follow.
Sound level meters
A sound level meter measures the sound pressure at its microphone and displays it in decibels with a chosen frequency weighting and time response. Modern integrating-averaging meters also calculate the equivalent continuous level, Leq, over a measurement period, the maximum and minimum levels, and the peak level. Many can record octave or one-third octave bands.
Meters are classified by accuracy under the international standard IEC 61672. Class 1 meters have tighter tolerances and are used for detailed and legal work; Class 2 meters are adequate for most occupational surveys. CSA Z107.56, Measurement of noise exposure, which several provinces reference, sets out the instrument requirements and procedures for occupational measurements.
Noise dosimeters
A noise dosimeter is a small integrating meter worn by the worker, with its microphone mounted on the shoulder near the ear. It records the A-weighted level continuously and calculates the dose, the Leq and usually a time history showing how the level changed during the shift. Because it goes wherever the worker goes, it captures exposure for mobile jobs such as maintenance, material handling and supervision that would be very hard to estimate from area readings.
Dosimeters must be set up correctly for the rule being assessed. The key settings are the criterion level, the exchange rate, the threshold below which sound is ignored, and the frequency and time weightings. A dosimeter set for an OSHA 90 dBA, 5 dB rule will give a very different dose from one set for an 85 dBA, 3 dB rule for exactly the same noise. Modern instruments can run several virtual dosimeters at once with different settings, which is useful for employers working across jurisdictions.
| Setting | Typical Canadian provincial assessment |
|---|---|
| Criterion level | 85 dBA (87 dBA for federal workplaces) |
| Exchange rate | 3 dB |
| Threshold | None, or a low threshold such as 70 or 75 dBA, so that all significant sound is counted |
| Frequency weighting | A for the dose; C for the peak |
| Time weighting | Usually slow; an integrating instrument computes the true energy average |
| Peak | C-weighted peak recorded, to compare with 140 dBC where that limit applies |
Calibration and quality
Every measurement session should begin and end with a field calibration check using an acoustic calibrator, a small device that produces a known level, typically 94 or 114 dB at 1,000 Hz, when fitted over the microphone. If the readings drift by more than a small tolerance, usually about 0.5 to 1 dB depending on the method, the measurements made since the last good check are suspect. Instruments and calibrators should also be sent for laboratory calibration at the interval the manufacturer and the measurement standard recommend, commonly once a year or every two years, and the certificates kept on file.
Other quality issues are just as important. The microphone should be fitted with a windscreen outdoors or near air movement, kept away from the body when hand-held, and on a dosimeter mounted on the shoulder of the worker's dominant side or the side facing the main source, not covered by clothing or a hood. Workers wearing dosimeters may bump, shout into or tap the microphone, which produces false peaks; a short conversation about the purpose of the measurement and a check of the time history reduce this problem. Electromagnetic interference from welding and radio transmitters can also cause spurious readings.
Planning an exposure assessment
A good exposure assessment follows a plan. International standard ISO 9612 and CSA Z107.56 describe three main strategies, and the choice depends on the work pattern.
| Strategy | How it works | Best for |
|---|---|---|
| Task-based | Divide the day into tasks, measure the Leq of each task and combine with the time spent on each | Well-defined tasks with predictable durations, such as an operator who runs, sets up and cleans a machine |
| Job-based | Take several random samples of exposure for workers in the same job group and combine them statistically | Groups of workers doing similar but variable work |
| Full-day | Measure each worker for the whole shift with a dosimeter, over several days | Mobile, unpredictable work, such as maintenance and supervision |
Whichever strategy is used, the plan should identify similar exposure groups, workers who do the same job in the same area and are expected to have similar exposure, so that not every worker needs to be measured every time. It should cover typical days and the noisiest normal days, not just quiet ones. It should note the production rate, machines running, doors open or closed and any unusual events, because these explain differences later. And it should record shift length, because long shifts change the comparison with an 8-hour limit.
Worked problem
Choosing a strategy
A food plant has three job groups: line operators who stand at the same filler all shift, sanitation workers who move through every room with pressure washers at night, and maintenance mechanics who respond to breakdowns anywhere in the plant. Which measurement strategy suits each group?
Show solution
- Line operators have a stable position and predictable tasks, so task-based measurement, or a few full-shift dosimeter samples, will give a reliable result.
- Sanitation workers move through different rooms with a very loud tool, so full-shift dosimetry is better, with a time history to show where the dose comes from.
- Maintenance mechanics have highly variable days, so several full-shift dosimeter measurements on different days are needed, and the group may need a job-based statistical estimate.
- Each group should be treated as a similar exposure group, with enough samples to capture day-to-day variation.
Answer: Task-based for line operators, full-day dosimetry for sanitation and repeated full-day dosimetry with a statistical estimate for maintenance.
Energy averaging of readings
When several sound level readings are taken at a workstation over time, they must be averaged on an energy basis, the same way levels are added in Lesson 2. Simple arithmetic averaging understates the exposure, because it treats a reading of 100 dBA as only a little worse than 90 dBA, when it carries ten times the energy.
import math, random

random.seed(4)
# One-minute LAeq readings at a cutting station over an hour (illustrative):
# mostly 86 to 90 dBA with a few minutes of very loud cutting.
readings = [random.uniform(86, 90) for _ in range(52)] + [random.uniform(100, 104) for _ in range(8)]
random.shuffle(readings)

arith = sum(readings) / len(readings)
energy = 10 * math.log10(sum(10 ** (L / 10) for L in readings) / len(readings))
quiet = 10 * math.log10(sum(10 ** (L / 10) for L in readings if L < 95) / 52)
print(f"Arithmetic average:   {arith:.1f} dBA")
print(f"Energy average (Leq): {energy:.1f} dBA")
print(f"Leq without the 8 loud minutes: {quiet:.1f} dBA")Arithmetic average: 89.8 dBA Energy average (Leq): 94.2 dBA Leq without the 8 loud minutes: 88.1 dBA
Eight minutes of loud cutting raise the hourly Leq by several decibels, and the arithmetic average misses most of that effect. The same principle explains why short, very loud tasks deserve so much attention in a survey.
Area surveys and noise maps
An area survey records sound levels across a workplace to identify noisy zones, decide where signs and mandatory protector areas are needed and show where workers should not linger. Readings are taken at the height of a standing or seated worker's ears, typically at workstations and on a grid through aisles and open areas, with the main machines running at normal production. The results are often drawn as a noise map, with contour lines or coloured zones at 80, 85, 90 and 95 dBA.
Noise maps are excellent communication tools. Workers can see at a glance where hearing protection is needed, and managers can see how much of the floor is affected. They should be dated and updated when equipment or layout changes. A map is not an exposure assessment, though: it shows levels at locations, not doses received by people.
Source measurements
To control noise, you need to know which sources and which parts of each source matter. Engineers use close measurements around a machine, switch-off tests, octave band and narrow-band frequency analysis, and sometimes sound intensity probes or acoustic cameras that show where sound radiates from. Even a simple sound level meter used carefully, combined with the source-ranking calculation in Lesson 2, will usually identify the main contributors: an air exhaust, a vibrating guard panel, a gear set, parts dropping into a metal bin.
Reporting results
A noise report should allow someone else to understand, check and repeat the measurements. At a minimum it should include the purpose, date and conditions, the instruments with serial numbers and calibration records, the settings used, the locations or workers measured and their tasks, the results with the shift length, a comparison with the applicable limit, the main contributing sources and clear recommendations. Results should be communicated to the workers measured and to the joint health and safety committee or representative.
Several provinces require records of noise exposure assessments to be kept and made available to workers. In Quebec, assessments must be repeated at least every five years where limits are exceeded, and within 30 days of changes that could increase exposure. Even where no frequency is set, reassess whenever processes, equipment, layout, shift patterns or production rates change.
Worked problem
Checking a dosimeter report
A dosimeter report for a forklift driver shows a dose of 310 per cent and a peak of 146 dBC at 10:42, while the time history shows steady levels of 84 to 88 dBA all morning. What should the reviewer check?
Show solution
- A peak of 146 dBC during steady moderate noise is unusual. It may come from a real impulse, such as a pallet dropped near the microphone, or from the microphone being knocked.
- Check the time history around 10:42: an isolated spike with no change in the surrounding levels suggests an artefact.
- Check the dosimeter settings: a dose of 310 per cent is too high for levels of 84 to 88 dBA under an 85 dBA, 3 dB rule over 8 hours, so the settings, shift length or a long loud period may explain it.
- Interview the driver and review field notes before accepting or discarding the result, and consider repeating the measurement.
Answer: Treat the result as suspect until the time history, settings and field notes are reviewed. Artefacts are common, but real impulses must not be dismissed without investigation.
Common mistakes
MistakeUsing a single sound level meter reading to estimate a mobile worker's daily exposure.
InsteadUse full-shift dosimetry or a task-based approach with time studies for mobile workers.
MistakeSkipping the calibration check before and after measurements.
InsteadCheck calibration with an acoustic calibrator at the start and end of each session and keep the records.
MistakeAveraging sound level readings arithmetically.
InsteadUse energy averaging, which correctly weights the louder readings.
MistakeMeasuring on a quiet day or with half the machines idle.
InsteadMeasure under normal and noisiest normal conditions and record what was running.
MistakeUsing dosimeter settings for the wrong jurisdiction.
InsteadSet the criterion level, exchange rate and threshold to match the rule being assessed.
Summary and key terms
- Different questions call for different measurements: screening, area surveys, exposure assessments, source identification, control evaluation and protector selection.
- A simple screening test is needing to raise your voice at about one metre, which suggests at least 85 dBA.
- Sound level meters measure levels at a place and time; dosimeters integrate a worker's exposure over a shift.
- Instrument settings, especially criterion level, exchange rate and threshold, must match the rule being assessed.
- Field calibration checks before and after each session, regular laboratory calibration and careful microphone placement make results trustworthy.
- Task-based, job-based and full-day strategies suit different work patterns, and readings must be averaged on an energy basis.
- Noise maps show where levels are high, and reports should be complete enough to check and repeat.
- Sound level meter
- An instrument that measures sound pressure level with a selected frequency weighting and time response.
- Integrating-averaging meter
- A sound level meter that calculates the equivalent continuous level over a measurement period.
- Noise dosimeter
- A wearable integrating meter that records a worker's noise exposure over a shift.
- Acoustic calibrator
- A device that produces a known sound level to check a meter or dosimeter before and after use.
- Threshold (dosimeter)
- The level below which a dosimeter ignores sound when calculating dose.
- Similar exposure group
- Workers expected to have similar noise exposures because they do similar work in similar areas.
- Task-based measurement
- An assessment that measures each task's level and combines it with the time spent on the task.
- Noise map
- A plan of a workplace showing zones or contours of sound level.
- Time history
- A record of how the sound level changed over the measurement period.
- Artefact
- A false reading caused by something other than the noise being assessed, such as knocking the microphone.
Practice problems
Work each problem on paper first, then reveal the answer to check.
What does needing to raise your voice at about one metre suggest?
Show answer
A level of roughly 85 dBA or more.
Why is a dosimeter better than a sound level meter for a maintenance worker?
Show answer
It moves with the worker and integrates exposure across all locations and tasks.
Name four settings that must be chosen on a dosimeter.
Show answer
Criterion level, exchange rate, threshold and frequency weighting (also time weighting and peak weighting).
What is the purpose of a field calibration check?
Show answer
To confirm the instrument reads correctly before and after measurements so that results can be trusted.
Readings of 88 and 98 dBA, each for half an hour, are taken. What is the energy average?
Show answer
10 log10((10^8.8 + 10^9.8) ÷ 2) ≈ 95.4 dBA.
Which measurement strategy suits workers with well-defined tasks?
Show answer
Task-based measurement.
Why should measurements cover the noisiest normal days?
Show answer
To avoid underestimating exposure and to protect workers on those days.
What can cause false peaks on a dosimeter?
Show answer
Knocking, tapping or shouting into the microphone, and electromagnetic interference.
Why is a noise map not an exposure assessment?
Show answer
It shows levels at locations, not the doses received by workers who move through them.
List four items a noise report should contain.
Show answer
Any four of purpose, date and conditions, instruments and calibration, settings, locations or workers, results, comparison with limits, sources and recommendations.
Lesson quiz · 5 questions
Score 60% or more to complete this lesson.
Create a free account to save your progress, take quizzes and earn a certificate.