
GEOM-499 · Lesson 9 of 12 · 20 min
Visualization and mapping
The clients will not read the adjustment output. They will look at maps. A city councillor deciding whether to require more monitoring will see a change map on a screen for perhaps a minute; a canal engineer will pan along the reach looking for the eroded sections; a resident on the crest may open the public map to see whether the slope below their house is moving. Each of them should come away with the right impression, which means the maps must be accurate, readable, honest about uncertainty and accessible to everyone, including people with low vision or colour vision deficiency. This lesson covers how the team designs those maps and the web map that delivers them.
Know the audience and the message
Liam starts by listing the audiences and what each needs to see. The city planner needs a site-wide overview: where change was detected, where it was not, and how confident the team is. The canal engineers need detail along the reach: cross-sections, erosion areas and the target movement above them. The public needs a simpler view that shows the monitoring is happening and what was found, without exposing private yards or sensitive sites. Each audience gets a different view of the same underlying data, and each view has one main message.
Writing the message first is a useful discipline. For the overview map it is: 'Most of the slope shows no detectable change; erosion and movement are concentrated above canal stations 0+625 to 0+700.' Every design decision is then tested against that sentence. Does the colour scheme make the erosion stand out? Does the legend make clear that white means no detectable change, not no change? Does the map show where the data are less reliable?
Colour for change maps
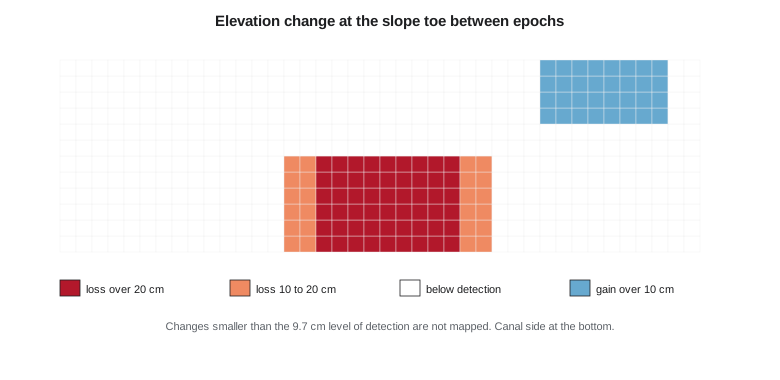
A DEM of difference has a natural midpoint at zero, so it calls for a diverging colour scheme: one hue for loss, another for gain and a neutral colour near zero. Red for loss and blue for gain is a common convention in change mapping and is reasonably safe for the most common forms of colour vision deficiency, which mainly affect red and green. Red and green together, a frequent first choice, is the scheme to avoid.
The neutral band matters as much as the colours. Liam classes the change map into five classes: loss over 20 cm, loss of 10 to 20 cm, no detectable change, gain of 10 to 20 cm and gain over 20 cm. The middle class is drawn in white or very light grey and labelled 'below level of detection (±9.7 cm)'. A continuous colour ramp through zero would invite readers to interpret tiny, meaningless differences. Classing at the level of detection builds the uncertainty into the map.
Contrast and accessibility
Colours that look distinct on a designer's monitor may be indistinguishable on a projector in a bright council chamber or to a reader with low vision. Web content accessibility guidelines give measurable targets. Under WCAG 2.1 level AA, normal text needs a contrast ratio of at least 4.5 to 1 against its background, and meaningful graphical elements, such as map symbols that convey information, need at least 3 to 1. In Alberta, provincial and federal accessibility expectations, including the federal Accessible Canada Act for federally regulated bodies, point to the same guidelines, and the city's own web standard requires level AA.
The contrast ratio is computed from the relative luminance of the two colours, a weighted combination of their red, green and blue components after converting them to linear light. The script checks the palette and estimates how big the tile pyramid for the web map will be.
# Coulee Watch: check web map colors and estimate the tile pyramid
import math
def lum(hexc):
    c = [int(hexc[i:i + 2], 16) / 255 for i in (1, 3, 5)]
    c = [x / 12.92 if x <= 0.03928 else ((x + 0.055) / 1.055) ** 2.4 for x in c]
    return 0.2126 * c[0] + 0.7152 * c[1] + 0.0722 * c[2]
def contrast(a, b):
    la, lb = sorted((lum(a), lum(b)), reverse=True)
    return (la + 0.05) / (lb + 0.05)
pairs = {"label text on white": ("#1f2933", "#ffffff"),
         "erosion class on white": ("#b2182b", "#ffffff"),
         "deposition class on white": ("#2166ac", "#ffffff"),
         "pale gold class on white": ("#f4d58d", "#ffffff"),
         "white label on dark ortho": ("#ffffff", "#3a3f2e")}
for k, (a, b) in pairs.items():
    r = contrast(a, b)
    need = 4.5 if "text" in k or "label" in k else 3.0
    print(f"{k:28s} {r:5.2f}:1  {'pass' if r >= need else 'fail'} (needs {need}:1)")
lat = 49.69 if "ca" == "ca" else 47.50
for z in (16, 18, 20, 21):
    res = 156543.03 * math.cos(math.radians(lat)) / 2 ** z
    print(f"zoom {z}: {res * 100:6.1f} cm per pixel")
w_m, h_m = 1500.0, 450.0
total = 0
for z in range(12, 22):
    res = 156543.03 * math.cos(math.radians(lat)) / 2 ** z
    tiles = math.ceil(w_m / (256 * res) + 1) * math.ceil(h_m / (256 * res) + 1)
    total += tiles
print(f"tiles for zoom 12 to 21: {total}, about {total * 28 / 1024:.0f} MB at 28 kB per tile")label text on white 14.76:1 pass (needs 4.5:1) erosion class on white 6.87:1 pass (needs 3.0:1) deposition class on white 5.90:1 pass (needs 3.0:1) pale gold class on white 1.42:1 fail (needs 3.0:1) white label on dark ortho 10.88:1 pass (needs 4.5:1) zoom 16: 154.5 cm per pixel zoom 18: 38.6 cm per pixel zoom 20: 9.7 cm per pixel zoom 21: 4.8 cm per pixel tiles for zoom 12 to 21: 6437, about 176 MB at 28 kB per tile
The label text, the red and blue classes and white labels on the dark imagery all pass. A pale gold that Liam had planned for a 'monitoring zone' outline fails badly at 1.42 to 1, so he replaces it with a dark gold outline and a dashed pattern, which passes and can also be distinguished without colour. Colour should never be the only way information is shown: the erosion classes also differ in lightness, and the targets that moved are shown with a filled symbol and a label as well as red.
Worked problem
Contrast ratio
A legend label in dark grey has relative luminance 0.0158 on a white background of luminance 1.0. Does it meet the 4.5 to 1 requirement for normal text?
Show solution
- \[\text{ratio} = \frac{L_1 + 0.05}{L_2 + 0.05} = \frac{1.0 + 0.05}{0.0158 + 0.05}\]
- \[\text{ratio} = \frac{1.05}{0.0658} = 16.0\]
Answer: The ratio is 16 to 1, far above 4.5 to 1. Accessibility problems come from pale colours on white or white on light imagery, not from dark text.
Showing uncertainty
A map that shows only the best estimate invites over-confidence. The team uses three techniques. The classed change map hides differences below the level of detection. A separate reliability layer shades in hatching the areas where the terrain model is less reliable: tall vegetation on the upper slope and the shadowed steep face where the drone saw the ground at a low angle. And target movement arrows are drawn with an ellipse showing their 95 percent uncertainty, so that a reader can see at a glance that T7 and T8 moved beyond their ellipses while the others did not.
The same honesty applies to the radar data. The radar velocities are shown as a separate, switchable layer of coloured points, labelled 'line-of-sight velocity, descending orbit, 2023 to 2026, mm per year', with a note that line-of-sight velocity understates downslope motion on this slope. Putting the radar points on the same map as the targets, with matching units and a clear label, lets the canal engineers see the disagreement discussed in lesson 7 for themselves.
Cartographic design
Good maps follow a few principles that apply whether they are printed or on screen. The most important information has the strongest visual weight: erosion areas and moving targets are bold, while the base imagery is slightly faded. Labels are placed close to their features without covering them. The legend uses the clients' words, not processing jargon: 'ground lowered by 10 to 20 cm' rather than 'DoD class 2'. A scale bar, north arrow, data date and coordinate system appear on every printed map. And the map is tested on someone who did not make it: Liam shows the draft overview to two students outside the project and asks them what it says. The first draft fails: both readers think the white area means 'no change' rather than 'no detectable change', so the legend is rewritten.
The web map
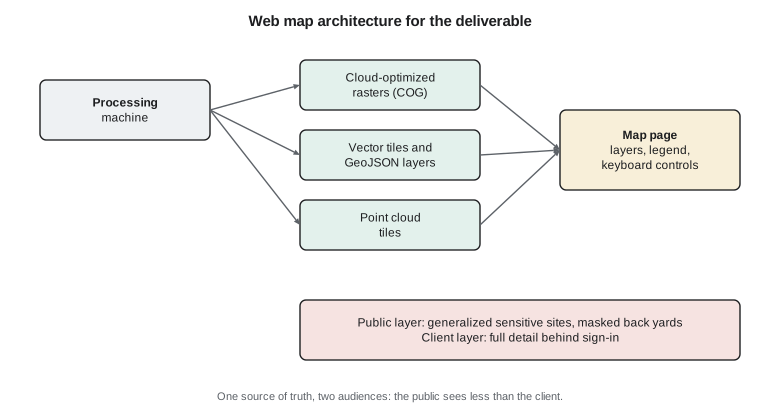
The web map is the main deliverable for day-to-day use. Liam builds it from open standards so that it can be hosted by the city or the district without special software. Rasters are stored as cloud-optimized GeoTIFFs, which a browser can read piece by piece. The terrain model and change map are served as map tiles. Vector layers, such as targets, cross-sections and the canal centreline, are delivered as vector tiles and as GeoJSON. The point clouds of the toe are converted to a streaming tile format that lets a viewer explore them in three dimensions.
At the site's latitude, a map tile at zoom level 21 has pixels about 5 cm across, close to the orthomosaic's 2.5 cm resolution, so the pyramid stops at zoom 21. From zoom 12 to 21 the site needs about six thousand tiles, around 160 to 180 MB at typical compression, which is easy to host. The full-resolution orthomosaic is available for download as a cloud-optimized GeoTIFF for anyone who needs every pixel.
The web page itself is designed for accessibility. Every control can be used from the keyboard. The layer list has text labels, not just icons. A text summary of the findings sits beside the map for screen reader users and for anyone who wants the answer without exploring. Pop-ups for targets and cross-sections show their values as text with units and uncertainties. The page is tested with an automated accessibility checker and by navigating it without a mouse.
Two audiences, two layers
The same data serve the public and the clients, but not the same views. The public layer masks the orthomosaic where it looks into private back yards along the crest and shows sensitive locations only as generalized cells, as lesson 10 explains. The client layer, behind a sign-in, shows everything. Keeping both views generated from one set of source data, by a scripted process, means that a correction to the data flows to both and that nobody has to remember to edit the public version by hand.
Printed maps and the final poster
Some outputs will be printed: a set of map sheets for the canal engineers to take on site, and a poster for the program's capstone exhibition. Print brings its own constraints. The colours are checked in print as well as on screen, because a blue that looks distinct on a monitor can darken on paper. Line weights are chosen so that the canal centreline and cross-section ticks remain visible at the printed scale. The sheets use a map series layout with an index map, consistent scale and overlapping edges, so that an engineer can walk the reach with them. The poster carries the main message as its title and the change map as its largest element, and it can be understood from two metres away in under a minute.
Common mistakes
MistakeUsing a red-green colour scheme for change.
InsteadUse a diverging scheme such as red and blue, and differ the classes in lightness too.
MistakeShowing every centimetre of difference with a continuous ramp.
InsteadClass the map at the level of detection and label the neutral class clearly.
MistakeChoosing pale colours that look fine on a bright monitor.
InsteadCompute contrast ratios: 4.5 to 1 for text, 3 to 1 for meaningful graphics.
MistakeAssuming readers interpret the legend as intended.
InsteadTest the map on people who did not make it and rewrite what they misread.
Summary and key terms
- Each audience needs a different view with one clear message, written before the map is designed.
- Change maps use diverging colours with a neutral class at the level of detection.
- WCAG 2.1 AA asks for 4.5 to 1 contrast for text and 3 to 1 for meaningful graphics; colour must not be the only cue.
- Uncertainty is shown with classing, reliability layers and error ellipses.
- Web maps built on open formats such as cloud-optimized GeoTIFF and vector tiles can be hosted by the client.
- Public and client views are generated from the same data by a scripted process.
- Diverging colour scheme
- A palette with two contrasting hues meeting at a neutral midpoint, used for data centred on zero.
- Contrast ratio
- The ratio of the relative luminances of two colours, plus 0.05 each, used in accessibility guidelines.
- WCAG
- The Web Content Accessibility Guidelines, which set measurable accessibility criteria for web content.
- Reliability layer
- A map layer showing where a product is less reliable.
- Cloud-optimized GeoTIFF
- A GeoTIFF arranged so that a client can read only the parts it needs over the web.
- Tile pyramid
- A set of map tiles at increasing zoom levels, each with twice the resolution of the one before.
Practice problems
Work each problem on paper first, then reveal the answer to check.
What message should the overview map carry?
Show answer
Most of the slope shows no detectable change; erosion and movement are concentrated above stations 0+625 to 0+700.
Why is the middle class labelled 'below level of detection' rather than 'no change'?
Show answer
Small changes may exist but cannot be distinguished from noise.
A symbol colour has a 2.4 to 1 contrast with the background. Does it pass for meaningful graphics?
Show answer
No; it needs at least 3 to 1.
How are target uncertainties shown?
Show answer
With 95 percent error ellipses around each target.
Why stop the tile pyramid at zoom 21?
Show answer
Its pixels are about 5 cm, close to the orthomosaic resolution; finer levels add nothing.
Name two accessibility features of the web page.
Show answer
Keyboard operation, text labels on controls, a text summary, text pop-ups (any two).
Lesson quiz · 5 questions
Score 60% or more to complete this lesson.
Create a free account to save your progress, take quizzes and earn a certificate.