
GEOM-430 · Lesson 11 of 12 · 20 min
Height modernization
Heights are where geodesy meets everyday engineering most directly. Water flows downhill, and the question of which way is downhill is answered by gravity, not by the ellipsoid. For more than a century, heights in North America were carried across the continent by spirit levelling from tide gauges. Both countries are now replacing those levelling-based datums with datums defined by a geoid model and reached by GNSS. This lesson explains the height systems involved, how the change is being made, and why heights, like positions, are becoming time-dependent.
From levelling to geopotential numbers
A level measures the height difference between two points along the local vertical. Summed along a line, those differences do not give a unique height, because level surfaces are not parallel: they converge towards the poles and wherever gravity is stronger. Two levelling routes between the same two benchmarks, through different terrain, give slightly different sums. The quantity that is unique is the difference in gravity potential. The geopotential number C of a point is the difference between the potential of the geoid, W₀, and the potential at the point, and it is obtained from levelling and gravity together.
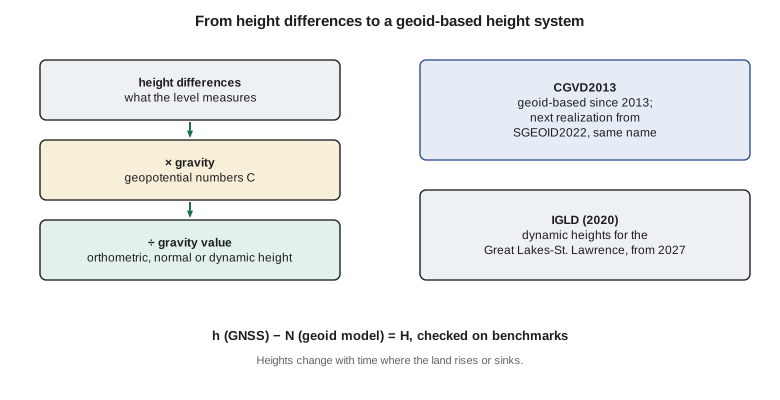
Heights are geopotential numbers divided by a gravity value, and the choice of that value defines the height system. Orthometric height divides by the mean gravity along the plumb line between the geoid and the point, which must be estimated, often with the Helmert approximation using the surface gravity and the Poincaré–Prey gradient. Normal height divides by mean normal gravity, which can be computed exactly. Dynamic height divides by a constant, conventionally normal gravity at 45° latitude, so that points on the same level surface have exactly the same height, which is what matters for water.
A levelling line with gravity
The code carries geopotential numbers along a short levelling line of four sections, starting from a benchmark of known orthometric height, using the observed gravity at each benchmark. At each benchmark it computes the orthometric height by the Helmert approximation and the dynamic height, and compares them with the plain sum of levelled differences.
# Geopotential numbers along a line of height differences with observed gravity, then three kinds of height.
H0 = 909.589                         # orthometric height of the starting benchmark, m
g0 = 9.808412                         # observed gravity at the starting benchmark, m/s2
# Each section: measured height difference (m) and observed gravity at the benchmark ahead (m/s2)
sections = [(12.418, 9.808391), (25.706, 9.808342), (-8.322, 9.808330), (41.950, 9.808262)]
gamma45 = 9.806199203             # normal gravity at 45 deg, the conventional value for dynamic heights
k = 0.0424e-5                     # Poincare-Prey gradient, 0.0424 mGal per m, in s^-2
C = (g0 + k * H0) * H0            # starting geopotential number from its known height (Helmert form)
H_lev, g_prev = H0, g0
for i, (dh, g) in enumerate(sections, 1):
    C += 0.5 * (g_prev + g) * dh  # geopotential difference = mean gravity x height difference
    H_lev += dh; g_prev = g
    H_orth = C / g                # first guess, then iterate the Helmert height
    for _ in range(3): H_orth = C / (g + k * H_orth)
    H_dyn = C / gamma45
    print(f"BM{i}: C {C:10.3f} m2/s2  summed {H_lev:9.4f}  orthometric {H_orth:9.4f}  dynamic {H_dyn:9.4f} m")
print(f"orthometric minus summed differences at the end: {(H_orth - H_lev) * 1000:+.1f} mm")
print(f"dynamic minus orthometric at the end: {(H_dyn - H_orth) * 100:+.1f} cm")
# Heights also change with time: glacial isostatic adjustment
for name, rate in [("CR1 Lethbridge", -0.8), ("Churchill, Hudson Bay", 10.5), ("Halifax", -1.5)]:
print(f"{name:22s} uplift {rate:+5.1f} mm/yr -> {rate * 25 / 10:+5.1f} cm over 25 years")BM1: C 9043.775 m2/s2 summed 922.0070 orthometric 922.0080 dynamic 922.2508 m BM2: C 9295.909 m2/s2 summed 947.7130 orthometric 947.7166 dynamic 947.9625 m BM3: C 9214.284 m2/s2 summed 939.3910 orthometric 939.3964 dynamic 939.6387 m BM4: C 9625.742 m2/s2 summed 981.3410 orthometric 981.3496 dynamic 981.5977 m orthometric minus summed differences at the end: +8.6 mm dynamic minus orthometric at the end: +24.8 cm CR1 Lethbridge uplift -0.8 mm/yr -> -2.0 cm over 25 years Churchill, Hudson Bay uplift +10.5 mm/yr -> +26.2 cm over 25 years Halifax uplift -1.5 mm/yr -> -3.8 cm over 25 years
Over the 72 m of net climb, the orthometric height at the last benchmark differs from the levelled sum by about 9 mm. That is the orthometric correction, caused by the variation of gravity along the line. The dynamic height is about 25 cm larger than the orthometric height at these benchmarks, because gravity near Lethbridge, at about 49.7° N, is stronger than the conventional value at 45°; dynamic heights are useful for water levels on a lake, not for elevations on land.
Why the old datums are being replaced
Levelling-based datums have two problems. First, they accumulate error: each kilometre of levelling adds a little random and systematic error, and across a continent the errors grow to decimetres. Second, they are hard to maintain: benchmarks are destroyed by construction and disturbed by frost, and the land moves, so a network levelled decades ago no longer represents the ground. Re-levelling a continent costs far more than any agency can afford.
CGVD28, Canada's old vertical datum, was defined by holding mean sea level fixed at several tide gauges and adjusting levelling across the country, and it was found to have errors of tens of centimetres, sloping from coast to coast. In 2013 Canada became one of the first countries to adopt a geoid-based datum: CGVD2013, defined by the equipotential surface W₀ = 62,636,856.0 m²/s², the convention agreed with the United States, and realized by a gravimetric geoid model. Users obtain CGVD2013 heights from GNSS ellipsoidal heights in NAD83(CSRS) and the geoid model: H = h − N. Benchmarks still have published heights, but they are derived from the geoid, not the reverse.
Natural Resources Canada has announced that the next realization of CGVD2013 will use SGEOID2022, a new gravimetric geoid computed jointly with the United States. The datum keeps its name and its W₀, so the change is a refinement: heights at most places will change by a few centimetres or less, with larger changes where the old model was weaker, such as in mountains and the north. The model will also include a time-dependent part, because the geoid rises over Hudson Bay as the land rebounds.
How good are GNSS heights?
A geoid-based datum is only as useful as the ellipsoidal heights users can measure. GNSS heights are about two to three times less precise than horizontal positions, because satellites are only above the horizon, and they are sensitive to the troposphere, antenna phase centre models, multipath and the length of the observation. As a rough guide, a single RTK measurement gives a height to two or three centimetres; a few hours of static data processed against nearby active stations, or with a precise point positioning service, gives about one to two centimetres; and a day or more of data, carefully processed, gives better than a centimetre. Adding the uncertainty of the geoid model, a centimetre or two, gives the uncertainty of the resulting height.
For many purposes that is enough. For others, such as setting the invert of a gravity sewer or a long, flat canal, levelling is still the better tool for height differences over short distances, because a good level gives millimetres per kilometre. The modern approach combines them: GNSS and the geoid model fix the datum at one or a few points, and levelling carries the precise differences across the project. Both countries' guidelines for height surveys reflect that combination, and set out observing times and checks needed to reach given accuracy classes.
Benchmarks after the change
Benchmarks do not disappear when a datum becomes geoid-based. They remain convenient: a surveyor can set up a level on a benchmark faster than running a GNSS session, and many users have no GNSS. But their role changes. Instead of defining the datum, they become points whose heights are derived from it and checked from time to time. Agencies publish their heights in the new datum, computed from GNSS observations and the geoid model, or transformed from the old datum where no GNSS is available, and flag those whose heights are less reliable. A surveyor using an old benchmark should check which kind of height it carries and when it was last verified.
Europe offers a useful comparison. Most European countries use normal heights and a quasigeoid, and the European Vertical Reference System combines national levelling networks into a continental datum. Its approach to the problem of differing gravity values is the same as North America's: geopotential numbers first, then a chosen height type. The choice of normal heights avoids assumptions about the density of rock inside mountains, at the cost of heights that are not quite the length of the plumb line. The two approaches give nearly identical results in flat country.
The Great Lakes and dynamic heights
The Great Lakes and the St. Lawrence River are shared by Canada and the United States, and their water levels are managed under treaties for navigation, hydropower and flood control. For that, both countries use a common datum, the International Great Lakes Datum, which uses dynamic heights so that a level water surface has the same height everywhere. The current version, IGLD (1985), is being replaced by IGLD (2020), based on the new geoid-based datums and on GNSS, with implementation planned for 2027. A new IGLD is needed every few decades because GIA tilts the lake basins: the northern shores rise relative to the southern ones, so a fixed datum gradually drifts out of step with the water.
In Canada, the Canadian Hydrographic Service and the Canadian Geodetic Survey lead the Canadian side of the IGLD work, together with the US agencies, through a coordinating committee of both countries.
Heights that change with time
Once heights are tied to the geoid and reached by GNSS, the motion of the land becomes visible in them. A benchmark in an area of GIA uplift rises relative to the geoid year by year, and a benchmark on compacting sediments sinks. Old datums hid this because they were defined by the benchmarks themselves; new ones expose it. The last lines of the code show what 25 years of vertical motion means at a few places.
At CR1, a subsidence of about 0.8 mm per year amounts to 2 cm in 25 years. Near Churchill on Hudson Bay, uplift of about a centimetre per year raises the land by about a quarter of a metre over the same period, which matters for the port and for the town's flood levels. At Halifax, slow subsidence of the former peripheral bulge adds to the local sea level rise. Rates in the code are approximate.
For engineering, this means that a published height has an epoch, just as a position does. For most projects over a few years, the change is negligible. For flood protection, drainage of flat land, long-lived structures near water, and comparisons with surveys decades old, it is not.
Worked problem
Height from GNSS and a geoid model
GNSS gives h = 893.412 m in NAD83(CSRS) at CR1. The geoid model gives N = −16.177 m. What is the CGVD2013 height?
Show solution
- \[H = h - N = 893.412 - (-16.177) = 909.589\ \text{m}\]
Answer: 909.589 m, the published CGVD2013 height of CR1.
Coulee Geomatics: the district's heights
The district's canal and drainage designs use heights from benchmarks levelled in several campaigns, some in CGVD28 and some in CGVD2013. Leah's briefing recommends converting everything to CGVD2013, with the geoid model version stated, and establishing a small set of project benchmarks whose heights are checked by both GNSS and levelling. For gravity-driven systems such as canals, where a few centimetres of fall over kilometres matter, she adds that the design should rely on levelled differences within the project, tied to CGVD2013 at one point, rather than on GNSS heights alone. Theo begins by listing every benchmark the district has used since the 1960s, with its datum, the date of its last levelling and its condition, so that the conversion can be planned from a complete inventory.
Common mistakes
MistakeTreating levelled sums as unique heights.
InsteadUse geopotential numbers; level surfaces are not parallel.
MistakeUsing dynamic heights for land elevations.
InsteadDynamic heights suit water surfaces; use orthometric or normal heights on land.
MistakeMixing ellipsoidal heights and geoid models from different frames.
InsteadUse the geoid model defined for the frame of the GNSS heights.
MistakeAssuming benchmark heights never change.
InsteadLand motion makes heights time-dependent; record the epoch.
Summary and key terms
- Geopotential numbers are unique; heights are geopotential numbers divided by a gravity value.
- Orthometric, normal and dynamic heights differ in the gravity value used.
- Levelling-based datums accumulate error and are hard to maintain.
- Canada and the United States have adopted geoid-based datums with W₀ = 62,636,856.0 m²/s².
- IGLD (2020), using dynamic heights, is to be implemented in 2027.
- Heights change with time where the land rises or sinks.
- Geopotential number
- The difference between the geoid's potential and the potential at a point.
- Orthometric height
- The geopotential number divided by mean gravity along the plumb line.
- Normal height
- The geopotential number divided by mean normal gravity.
- Dynamic height
- The geopotential number divided by a constant gravity value.
- Orthometric correction
- The difference between a levelled sum and the orthometric height difference.
- IGLD
- The International Great Lakes Datum, using dynamic heights.
Practice problems
Work each problem on paper first, then reveal the answer to check.
Why do two levelling routes between the same benchmarks give different sums?
Show answer
Level surfaces are not parallel, so height differences depend on the route.
Which height system gives the same height to all points on a level water surface?
Show answer
Dynamic heights.
GNSS gives h = 912.604 m; the geoid model gives N = −16.149 m. What is H?
Show answer
928.753 m.
Why must the IGLD be updated every few decades?
Show answer
GIA tilts the lake basins relative to the datum.
What W₀ do the new North American datums use?
Show answer
62,636,856.0 m²/s².
Lesson quiz · 5 questions
Score 60% or more to complete this lesson.
Create a free account to save your progress, take quizzes and earn a certificate.