
GCP-221 · Lesson 9 of 12 · 19 min
Looker semantic models
▶ Video coming soon A video version of this lesson is on the way.
On Wednesday, November 4, Ravi introduces Mateo to Birchline's Looker instance, which Finance and the executive team use for monthly reporting. The store manager dashboard in Data Studio is quick to change, but Lena has noticed that "net sales" in Finance's Looker dashboards differs slightly from the figure in the analytics team's reports. The cause turns out to be a single difference in how gift card sales are treated. The fix, and the reason Looker exists, is a semantic model: one place where every important metric is defined, reviewed and reused.
What a semantic model is
A semantic model, sometimes called a semantic layer, sits between the warehouse tables and the people who ask questions. It translates database columns into business terms, defines how each measure is calculated, says how tables join, and controls who sees what. Users then explore by choosing fields such as "Store region" and "Net sales", and the tool writes the SQL. Because every query is generated from the same definitions, two people asking the same question get the same answer.
In Looker, the semantic model is written in LookML, a text language stored in files and managed with Git. Looker does not copy the data: it generates SQL from the model and runs it in BigQuery, so freshness and cost follow the warehouse.
Views, dimensions and measures
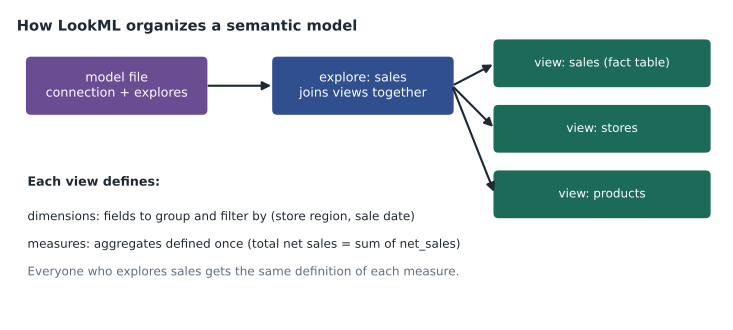
A LookML view usually corresponds to one table or derived table. It names the table with sql_table_name and defines fields. A dimension is a field to group or filter by; a dimension group of type time creates a set of date fields at once, such as date, week and month. A measure is an aggregate such as sum, count, count_distinct or average.
view: sales {
  sql_table_name: `bl-data-prod.curated.sales` ;;

  dimension: sale_line_id {
    primary_key: yes
    hidden: yes
    sql: ${TABLE}.sale_id ;;
  }
  dimension: channel {
    type: string
    sql: ${TABLE}.channel ;;
  }
  dimension_group: sale {
    type: time
    timeframes: [date, week, month, year]
    datatype: date
    sql: ${TABLE}.sale_date ;;
  }
  measure: net_sales {
    type: sum
    sql: ${TABLE}.net_sales ;;
    value_format_name: usd_0
    label: "Net sales"
    description: "Sales after discounts, with refunds as negative values. Excludes gift card sales, which are not revenue until redeemed."
  }
  measure: transactions {
    type: count_distinct
    sql: ${TABLE}.txn_id ;;
  }
}
The gift card difference is settled in the measure's description and its SQL. Finance treats gift card sales as a liability until the card is used, so the governed definition excludes them; the analytics team's view had included them. Once the LookML measure is changed to filter out the gift card SKU group and reviewed, every Looker dashboard and every explore uses the corrected figure the next time it runs. Ravi then changes v_store_daily in BigQuery to match, so Data Studio agrees too.
Explores and joins
An explore is the starting point users choose when they ask a question, such as "Sales". It is defined in a model file, which also names the database connection. The explore lists the views that can be joined to the base view, the join conditions and the relationship between them.
connection: "bigquery_prod"
include: "/views/*.view.lkml"

explore: sales {
  label: "Sales"
  join: stores {
    type: left_outer
    relationship: many_to_one
    sql_on: ${sales.store_id} = ${stores.store_id} ;;
  }
  join: products {
    type: left_outer
    relationship: many_to_one
    sql_on: ${sales.sku} = ${products.sku} ;;
  }
}
The relationship parameter is not decoration. Many sales rows belong to one store, so the relationship is many_to_one. Looker uses relationships and primary keys to apply symmetric aggregates: when a join could fan out, as described in lesson 3, Looker writes SQL that sums each row of a table only once, using its primary key. This is one of Looker's most valuable features, because it makes fan-out errors much harder to produce by accident. It only works if every view has a correct primary key.
import sqlite3
db = sqlite3.connect(":memory:")
db.executescript("""
CREATE TABLE stores (store_id INT PRIMARY KEY, region TEXT, target REAL);
INSERT INTO stores VALUES (12, 'East', 50000), (15, 'East', 70000);
CREATE TABLE sales (sale_id INT PRIMARY KEY, store_id INT, net_sales REAL);
INSERT INTO sales VALUES (1, 12, 200), (2, 12, 300), (3, 15, 400), (4, 15, 100), (5, 15, 250);
""")
naive = """SELECT SUM(st.target) FROM sales s JOIN stores st USING (store_id)"""
# Symmetric aggregate idea: add each store's target once, identified by its primary key
symmetric = """SELECT SUM(target) FROM (
                 SELECT DISTINCT st.store_id, st.target
                 FROM sales s JOIN stores st USING (store_id))"""
print("true total target:", db.execute("SELECT SUM(target) FROM stores").fetchone()[0])
print("naive sum after join:", db.execute(naive).fetchone()[0])
print("summed once per store:", db.execute(symmetric).fetchone()[0])true total target: 120000.0 naive sum after join: 310000.0 summed once per store: 120000.0
What this code does
Showing the problem that symmetric aggregates solve. Two stores have monthly targets, and five sale lines are joined to them. Adding up the targets after the join counts each store's target once for every sale line, so the total is far too large. Counting each store only once, using its key, gives the true total again, which is what Looker does automatically when primary keys and relationships are defined.
The naive sum gives 310,000 dollars because store 12's target is counted twice and store 15's three times. The true total is 120,000. A user who asks Looker for "total target by region" from the Sales explore gets 120,000, because the stores view declares store_id as its primary key and the join as many_to_one.
Adjusting simple LookML parameters
The exam expects an associate practitioner to make simple changes to an existing model, not to design one from scratch. The parameters below cover most such changes.
| Parameter | Where | What it changes | Example |
|---|---|---|---|
| label | Field, view, explore | The name users see | label: "Net sales" |
| description | Field, explore | Help text shown in the field picker | Explains what is included |
| hidden | Field, explore | Hides a field from the picker but keeps it usable in other fields | Hide raw IDs |
| type | Dimension, measure | Data type or aggregate | type: sum, type: count_distinct |
| sql | Field | The expression behind the field | The table column or a SQL expression |
| value_format_name | Field | Number formatting | usd_0, decimal_2 |
| drill_fields | Measure, view | Fields shown when a user clicks a value to drill in | [store_id, sale_date] |
| group_label | Field | Groups fields under a heading in the picker | group_label: "Returns" |
| filters | Measure | Restricts a measure to certain rows | filters: [channel: "store"] |
Mateo's first change is small. Store managers find the measure called "transactions" confusing, so he adds label: "Baskets" and a description, and creates a filtered measure for store-channel sales using the filters parameter. He makes the change in Development Mode, where his edits affect only his own view of the model. Looker's LookML validator checks the syntax and references; he tests the new fields in an explore; then he commits the change to Git and opens a pull request. Ravi reviews it, and only after it is merged and deployed to production do other users see the new label.
| Step | Where it happens | Who sees the change |
|---|---|---|
| Edit LookML files | Development Mode, in a personal branch | Only the developer |
| Validate | LookML validator | Only the developer |
| Test in an explore | Development Mode | Only the developer |
| Commit and request review | Git, through the Looker IDE | Reviewers |
| Merge and deploy to production | Production Mode | Everyone with access |
Derived tables and caching
Sometimes the right view is not a table but a query. A derived table is a view defined by SQL in LookML. A persistent derived table (PDT) is written to the database as a table and rebuilt on a schedule or when a trigger changes, which suits expensive summaries. Many teams now prefer to build such tables in BigQuery with scheduled queries or Dataform, as in lesson 5, and point a plain view at them, so the logic is available outside Looker too. Looker also caches query results according to datagroups, which can be tied to the warehouse's load schedule so that cached results expire when new data arrives.
Looker as a semantic layer for other tools
Looker's definitions are not only for Looker dashboards. Data Studio can connect to Looker explores through a connector, so a Data Studio report can use governed measures while keeping Data Studio's flexible design. Connected Sheets can also use Looker models, and Looker's SQL interface lets other BI tools query the model. Birchline plans to use this for the store manager dashboard: the layout stays in Data Studio Pro, while net sales and the return rate come from the governed Looker model, so managers and Finance see the same numbers.
| Need | Approach |
|---|---|
| A new metric for one ad hoc report | Calculated field in Data Studio |
| A metric many teams rely on | Measure in the LookML model, reviewed and deployed |
| A business user who prefers spreadsheets | Connected Sheets on the Looker model or a BigQuery view |
| A heavy summary used everywhere | A BigQuery table built on a schedule, exposed as a LookML view |
Common mistakes
MistakeLeaving out primary keys in LookML views.
InsteadDeclare a primary key in every view so symmetric aggregates can prevent fan-out.
MistakeSetting every relationship to one_to_one without checking.
InsteadState the real relationship, usually many_to_one from a fact table to a reference table.
MistakeEditing the production model directly.
InsteadWork in Development Mode, validate, test, commit and get the change reviewed before deploying.
MistakeRedefining a governed metric as a calculated field in each report.
InsteadReuse the measure from the model so every report agrees.
Working with an existing model
Most associate-level LookML work starts in someone else's model, so Ravi shows Mateo how to find his way around. The Looker IDE lists files by type: model files ending in .model.lkml, view files ending in .view.lkml, and sometimes dashboards defined in LookML ending in .dashboard.lookml. From any field in an explore, the menu option to go to LookML jumps straight to its definition, which is the fastest way to answer "how is this calculated?" The SQL tab in an explore shows the exact SQL Looker generated, which helps when a number looks wrong and you want to see the joins and filters it used.
Changes that look small can have wide effects. Renaming a field breaks any saved Look or dashboard tile that uses it, so Looker offers the alias parameter to keep old names working; the Content Validator finds saved content broken by a change before users do. Hiding a field is safer than deleting it. And because the model is in Git, every change has an author, a date and a review, which is exactly what Finance needs when it asks who changed the definition of net sales and why.
Worked problem
Fixing a fan-out total
The Sales explore joins stores to sales. A user asks for total store floor area by region and gets 2.1 million square metres, but the forty stores together have only 52,000 square metres. The stores view has no primary key and the join has no relationship. What is wrong and how is it fixed?
Show solution
- Each store row is repeated once for every sale line joined to it, so its floor area is added many times.
- Looker can only apply symmetric aggregates when the view declares a primary key.
- Add primary_key: yes to stores.store_id and relationship: many_to_one to the join.
- Validate in Development Mode, check that the total is 52,000, then commit and deploy.
Answer: The join fans out and the floor area is summed once per sale line. Declaring the primary key and the many_to_one relationship lets Looker sum each store once, giving the correct 52,000 square metres.
Summary and key terms
- A semantic model translates warehouse columns into business terms and defines each metric once, so everyone gets the same answer.
- In Looker it is written in LookML and managed with Git, and Looker generates SQL that runs in BigQuery.
- Views name tables and define dimensions, dimension groups and measures; models name the connection and define explores, which join views with a type, a condition and a relationship.
- Primary keys and relationships let Looker apply symmetric aggregates and avoid fan-out.
- Analysts commonly adjust label, description, hidden, type, sql, value_format_name, drill_fields, group_label and filters, working in Development Mode with validation and review.
- Derived tables, datagroups and connectors to Data Studio and Connected Sheets extend the model.
- Semantic model
- A layer that defines business fields, metrics and joins on top of warehouse tables.
- LookML
- The modelling language used to define Looker's semantic model.
- View
- A LookML object that maps to a table or derived table and defines fields.
- Explore
- A LookML starting point that joins views for users to query.
- Measure
- A LookML aggregate field, such as a sum or count distinct.
- Symmetric aggregates
- Looker's technique for summing each row once even when joins fan out.
- Development Mode
- A Looker mode where a developer's LookML changes affect only them.
- Persistent derived table
- A LookML-defined query result stored as a table and rebuilt on a schedule or trigger.
Practice problems
Work each problem on paper first, then reveal the answer to check.
What two things must be declared for symmetric aggregates to work?
Show answer
A primary key in each view and the correct relationship on each join.
Which parameter changes the name users see for a field?
Show answer
label.
Where should a developer test a LookML change before others see it?
Show answer
In Development Mode, after running the LookML validator.
How can a Data Studio report use governed Looker metrics?
Show answer
By connecting to a Looker explore through the Looker connector.
Lesson quiz · 5 questions
Score 60% or more to complete this lesson.
Create a free account to save your progress, take quizzes and earn a certificate.