
GCP-221 · Lesson 6 of 12 · 19 min
BigQuery ML for practitioners
▶ Video coming soon A video version of this lesson is on the way.
On Friday, October 23, Lena brings a question that SQL alone cannot answer. Web orders are returned far more often than store purchases, and each return costs Birchline shipping both ways plus the time to inspect and restock. She asks whether the team could flag orders that are likely to come back, so customer service can send a sizing guide or a short call before the parcel ships. Ravi sees a good first machine learning project: a clear question, a label in historical data, and a decision that a prediction could improve.
What BigQuery ML is
BigQuery ML lets you create, train, evaluate and use machine learning models with SQL, inside BigQuery. The training data never leaves the warehouse, there is no separate infrastructure to manage, and the results can be queried like any table. For an analyst who already knows SQL, it removes most of the barriers to trying a model.
BigQuery ML offers several kinds of model, and the exam expects you to match a use case to a type.
| Model type (MODEL_TYPE) | Predicts or finds | Example at Birchline |
|---|---|---|
| LINEAR_REG | A number | Expected weekly sales of a store |
| LOGISTIC_REG | A category, often yes or no | Whether a web order will be returned |
| BOOSTED_TREE_CLASSIFIER / REGRESSOR, RANDOM_FOREST | Category or number, often more accurately for complex patterns | Return risk with many interacting features |
| KMEANS | Groups of similar rows, without labels | Customer segments by buying pattern |
| ARIMA_PLUS | Future values of a time series | Daily sales forecast for each store |
| MATRIX_FACTORIZATION | Recommendations | Products a customer may like |
| AUTOML_CLASSIFIER / REGRESSOR | Category or number, with automatic model search | When accuracy matters more than training time and cost |
| Remote models | Whatever the hosted model does | A Gemini model summarizing return reasons |
Some model types train inside BigQuery; others, such as boosted trees, deep neural networks and AutoML, are trained by Google's managed machine learning platform, Vertex AI, and appear in BigQuery as models you can use with the same SQL. Google's current documentation calls that platform the Agent Platform in places; the BigQuery SQL is the same either way. AutoML tries many model designs automatically and is a good choice when the team needs the best accuracy it can get and accepts a longer, more expensive training run.
Planning a machine learning project
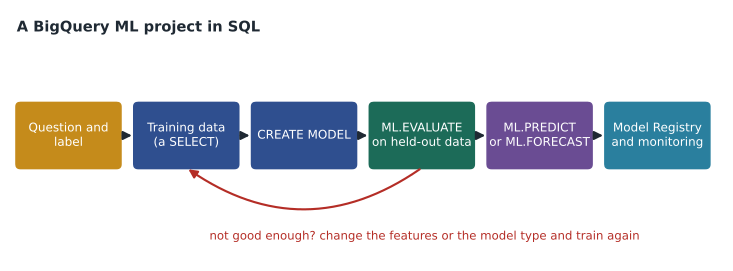
Ravi insists on writing the plan before any SQL. A model is only useful if the prediction leads to a decision, and if the data at prediction time matches the data used in training.
| Step | Decision for the return-risk model |
|---|---|
| Question | Will this web order be returned within 30 days of delivery? |
| Label | returned: true if a return was received within 30 days |
| Features | Product category, size count in the basket, first order or repeat, order value, delivery region, prior return rate of the customer |
| Training data | Web orders from January 2024 to June 2026, so every order has had time to be returned |
| Avoid leakage | No feature that is only known after shipping, such as the return reason |
| Use | Score each new order at checkout; flag the top-risk orders for a sizing email |
| Success measure | Fewer returns among flagged orders, compared with a group that gets no email |
Two items in the plan prevent common failures. Label timing: orders from the last month cannot be labelled yet, because their 30 days have not passed, so including them would teach the model that recent orders are rarely returned. Leakage: a feature that is only known after the outcome, such as the return reason, makes a model look brilliant in testing and useless in practice. The return reason is perfectly predictive of a return, and it is never available at checkout.
Training a model with SQL
A model is created with CREATE MODEL, and its training data is simply a SELECT statement. The column named in INPUT_LABEL_COLS is the label; every other column is a feature.
CREATE OR REPLACE MODEL `bl-data-prod.analytics.return_risk`
OPTIONS (
  model_type = "LOGISTIC_REG",
  input_label_cols = ["returned"],
  data_split_method = "RANDOM",
  data_split_eval_fraction = 0.2,
  auto_class_weights = TRUE
) AS
SELECT
  category, items_in_basket, sizes_in_basket, is_first_order,
  order_value, delivery_region, customer_prior_return_rate,
  returned
FROM `bl-data-prod.analytics.web_orders_training`
WHERE order_date BETWEEN "2024-01-01" AND "2026-06-30";
The options say what kind of model to train and how to hold back data for evaluation. Here, 20 rows in every 100 are set aside at random and not used for training, so the evaluation measures how the model does on orders it has never seen. For time-based data, a split by date, training on older orders and evaluating on newer ones, often gives a more honest picture, and BigQuery ML supports that with a SEQ split on a date column. auto_class_weights helps when one outcome is much rarer than the other: only about 15 in every 100 web orders are returned, and without weighting a model can score well simply by predicting "kept" for everything.
Training cost follows the bytes processed by the training query, with BigQuery ML's own rates for model creation, so filtering and selecting columns matter just as much as in any other query.
Evaluating a classification model
ML.EVALUATE reports how well the model does on the held-out rows. For a classifier, it returns precision, recall, accuracy, F1 score, log loss and ROC AUC. The first four come from the confusion matrix, which counts the four ways a yes-or-no prediction can turn out.
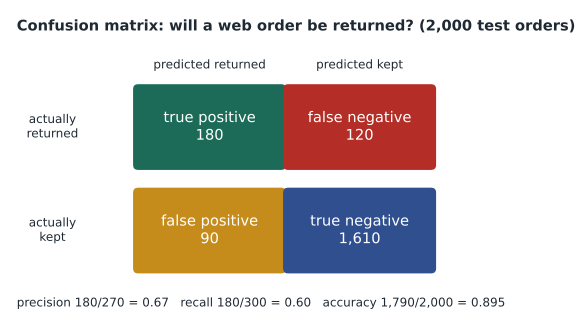
Precision answers: of the orders we flagged, how many were really returned? Recall answers: of the orders that were returned, how many did we flag? Accuracy is the share of all predictions that were right, which is misleading when one outcome is rare: a model that never flags anything would be right on 1,700 of these 2,000 orders, an accuracy of 0.85, while catching no returns at all. F1 combines precision and recall into one number. ROC AUC summarizes how well the model ranks returned orders above kept ones across all thresholds, from 0.5 for guessing to 1.0 for perfect.
A classifier produces a probability, and a threshold turns it into a yes or no. BigQuery ML uses 0.5 by default, but the right threshold depends on costs. A sizing email costs almost nothing, so Lena would rather flag more orders and catch more returns, accepting more false alarms. The calculation below shows how the choice of threshold changes the counts for the 2,000 test orders.
def metrics(tp, fn, fp, tn):
    precision = tp / (tp + fp)
    recall = tp / (tp + fn)
    accuracy = (tp + tn) / (tp + fn + fp + tn)
    f1 = 2 * precision * recall / (precision + recall)
    return precision, recall, accuracy, f1

# Counts on the same 2,000 held-out orders at three thresholds (300 were returned)
by_threshold = {
    0.7: (120, 180, 40, 1660),
    0.5: (180, 120, 90, 1610),
    0.3: (240, 60, 260, 1440),
}
print("threshold  flagged  precision  recall  accuracy  f1")
for t, (tp, fn, fp, tn) in by_threshold.items():
    p, r, a, f = metrics(tp, fn, fp, tn)
print(f"{t:9} {tp + fp:7} {p:9.2f} {r:6.2f} {a:8.3f} {f:.2f}")threshold flagged precision recall accuracy f1
0.7 160 0.75 0.40 0.890 0.52
0.5 270 0.67 0.60 0.895 0.63
0.3 500 0.48 0.80 0.840 0.60What this code does
Working out the evaluation measures at three probability thresholds. Each threshold gives four counts: returns caught, returns missed, false alarms and correctly ignored orders. The function turns those counts into precision, recall, accuracy and F1. The output shows that lowering the threshold flags more orders and catches more returns, while a larger share of the flags turn out to be false alarms.
At 0.3, the model flags 500 orders and catches 240 of the 300 returns, a recall of 0.80, but less than half the flagged orders are really returned. For a free email that is a good trade; for a phone call that takes ten minutes of an agent's time, the 0.5 or 0.7 threshold may be better. Choosing the threshold is a business decision, and the analyst's job is to lay out the trade-off clearly.
Making predictions
ML.PREDICT applies a trained model to new rows and returns the original columns plus the prediction and the probability of each class. For regression models it returns the predicted number. ML.EXPLAIN_PREDICT also returns the features that contributed most to each prediction, which helps customer service understand why an order was flagged.
SELECT order_id, predicted_returned, prob.prob AS return_probability
FROM ML.PREDICT(
  MODEL `bl-data-prod.analytics.return_risk`,
  (SELECT * FROM `bl-data-prod.analytics.web_orders_today`),
  STRUCT(0.3 AS threshold)),
  UNNEST(predicted_returned_probs) AS prob
WHERE prob.label = TRUE
ORDER BY return_probability DESC;
Forecasting
Lena's second request is a sales forecast for the holiday season. ARIMA_PLUS models a time series, handling trend, weekly and yearly patterns and holidays, and can train one model per store in a single statement by naming a time series ID column. ML.FORECAST then returns predicted values with a prediction interval for each future date. BigQuery also offers AI.FORECAST, which uses Google's pretrained TimesFM time series model and needs no training step at all; it is a quick baseline to compare against a trained model.
CREATE OR REPLACE MODEL `bl-data-prod.analytics.store_sales_forecast`
OPTIONS (model_type = "ARIMA_PLUS", time_series_timestamp_col = "sale_date",
         time_series_data_col = "net_sales", time_series_id_col = "store_id",
         holiday_region = "CA")
AS SELECT sale_date, store_id, net_sales
   FROM `bl-data-prod.curated.v_store_daily`
   WHERE sale_date BETWEEN "2023-01-01" AND "2026-10-22";

SELECT * FROM ML.FORECAST(MODEL `bl-data-prod.analytics.store_sales_forecast`,
                          STRUCT(70 AS horizon, 0.9 AS confidence_level));
Generative AI models from BigQuery
BigQuery can also call Google's pretrained large language models. After an administrator creates a connection to Vertex AI and a remote model that points at a Gemini model, SQL functions such as ML.GENERATE_TEXT, and the newer AI.GENERATE family, send each row's text to the model and return the response as a column. Lena's team plans to use this to group the free-text return comments into themes. The usual cautions apply: the output should be checked against a sample read by a person, and the data sent must be allowed to leave the table, which rules out personal details unless policy says otherwise.
Managing models
Models are objects in a dataset, with their own permissions, labels and descriptions. They can also be registered in the Vertex AI Model Registry, which keeps versions, records evaluation results and allows a model to be deployed to an endpoint for online predictions outside BigQuery. Ravi registers the return-risk model with a description of its training window, features and evaluation, so that anyone retraining it next year can compare like with like. Models also drift: if customers or products change, last year's patterns stop holding, so the team plans to re-evaluate the model each quarter on recent orders.
Common mistakes
MistakeIncluding features that are only known after the outcome, such as the return reason.
InsteadUse only information available at the moment of prediction, to avoid leakage.
MistakeJudging a model on accuracy when the outcome is rare.
InsteadLook at precision, recall and ROC AUC; a model that never flags anything can still have high accuracy.
MistakeLeaving the threshold at 0.5 without thinking.
InsteadChoose the threshold from the cost of false alarms and missed cases.
MistakeTraining on recent rows whose label is not yet known.
InsteadExclude rows that have not had time for the outcome to happen.
Worked problem
Reading a confusion matrix
On 2,000 test orders, the model at threshold 0.5 gave 180 true positives, 120 false negatives, 90 false positives and 1,610 true negatives. Calculate precision, recall, accuracy and F1.
Show solution
- Precision = TP / (TP + FP) = 180 / 270 = 0.667.
- Recall = TP / (TP + FN) = 180 / 300 = 0.600.
- Accuracy = (TP + TN) / total = 1,790 / 2,000 = 0.895.
- \[F_1 = \frac{2 \times 0.667 \times 0.600}{0.667 + 0.600} = 0.632\]
Answer: Precision 0.67, recall 0.60, accuracy 0.895 and F1 about 0.63. Two in three flags are real returns, and the model catches three in five returns.
Summary and key terms
- BigQuery ML trains and uses models with SQL inside BigQuery.
- Linear regression predicts numbers, logistic regression and boosted trees predict categories, k-means finds groups, ARIMA_PLUS forecasts time series, matrix factorization recommends, AutoML searches for the best model, and remote models call hosted models such as Gemini.
- Plan first: question, label, features available at prediction time, training window and how success will be measured.
- CREATE MODEL trains from a SELECT; ML.EVALUATE reports precision, recall, accuracy, F1 and ROC AUC; ML.PREDICT and ML.FORECAST make predictions.
- Choose a threshold from business costs, avoid leakage, register models with their evaluation, and re-evaluate them as data changes.
- BigQuery ML
- Creating and using machine learning models with SQL inside BigQuery.
- Label
- The column a supervised model learns to predict.
- Feature
- An input column a model uses to make predictions.
- Leakage
- Using information in training that would not be available when predicting.
- Precision
- The share of positive predictions that were correct.
- Recall
- The share of actual positives that the model found.
- Threshold
- The probability above which a classifier predicts the positive class.
- ARIMA_PLUS
- A BigQuery ML model type for time series forecasting.
Practice problems
Work each problem on paper first, then reveal the answer to check.
Why is accuracy misleading for a return model when 15 in 100 orders are returned?
Show answer
A model that predicts "kept" for everything is right 85 times in 100 while finding no returns.
What does lowering the threshold usually do?
Show answer
It flags more cases, raising recall and usually lowering precision.
Which function forecasts with Google's pretrained time series model without training?
Show answer
AI.FORECAST.
Why exclude the most recent month of orders from training?
Show answer
Their 30-day return window has not ended, so their labels are not yet known.
Lesson quiz · 5 questions
Score 60% or more to complete this lesson.
Create a free account to save your progress, take quizzes and earn a certificate.