
ELE-380 · Lesson 4 of 12 · 32 min
Transmission line models
Transmission lines are the arteries of the power system, and their electrical behaviour sets how much power can be moved, how voltages vary along the network, and how faults propagate. A line is not just a resistance: its conductors produce magnetic fields that give it series inductance, and the voltage between conductors and to ground gives it shunt capacitance. Over long distances these distributed parameters make a line behave like a wave guide, with surprising effects such as the voltage at an unloaded line's far end rising above the sending voltage. This lesson derives line parameters from conductor geometry, develops short, medium and long line models, explains surge impedance loading, the power-angle relationship and the limits on line loading, and introduces compensation and underground cables.
Line parameters
Resistance
The resistance of a conductor is \(R = \rho\ell/A\) at DC, adjusted for temperature (aluminium resistance rises about 0.4% per °C) and for skin effect, which concentrates AC current toward the surface and raises the effective resistance by a few percent at 60 Hz for large conductors. Overhead lines use aluminium conductor steel-reinforced (ACSR) or all-aluminium alloy conductors, in which the aluminium strands carry the current and a steel core provides strength. Line resistance is small compared with reactance at transmission voltages (an \(X/R\) ratio of 5 to 15 is typical), but it determines losses.
Inductance
Current in each phase conductor produces a magnetic field that links the conductor itself and the other phases. For a three-phase line with transposed conductors (each phase occupies each position for a third of the length, which balances the phases), the inductance per phase per metre is
where \(D_{eq}\) is the geometric mean distance (GMD) between phases and \(D_s\) is the geometric mean radius (GMR) of the conductor, about 0.78 times its radius for a solid round conductor and given in conductor tables for stranded conductors. Inductance grows only logarithmically with spacing, so it varies little between lines: about 0.8 to 1.3 mH/km, or a reactance of 0.3 to 0.5 Ω/km at 60 Hz.
Capacitance
The charge on the conductors creates an electric field between phases and to ground. For a transposed three-phase line, the capacitance to neutral per phase per metre is
with \(r\) the conductor's outer radius and \(\varepsilon_0 = 8.854 \times 10^{-12}\) F/m. Typical values are 8 to 14 nF/km, a shunt susceptance of 3 to 5 µS/km. The capacitance draws a charging current that flows even when the line is unloaded.
Worked problem
Parameters of a 230 kV line
A 230 kV line has three conductors in a flat (horizontal) arrangement with 7 m between adjacent phases. Each conductor has an outer radius of 15 mm and a GMR of 12 mm. Find the series reactance and shunt susceptance per kilometre at 60 Hz.
Show solution
- GMD: \(D_{eq} = \sqrt[3]{7 \times 7 \times 14} = 8.82\) m.
- Inductance: \(L = 2 \times 10^{-7}\ln(8.82/0.012) = 2 \times 10^{-7} \times 6.60 = 1.32\) µH/m; \(X = 2\pi \times 60 \times 1.32 \times 10^{-3} = 0.498\) Ω/km.
- Capacitance: \(C = 2\pi \times 8.854 \times 10^{-12}/\ln(8.82/0.015) = 5.563 \times 10^{-11}/6.377 = 8.72\) pF/m; \(B = 2\pi \times 60 \times 8.72 \times 10^{-9} = 3.29\) µS/km.
Answer: About 0.50 Ω/km and 3.3 µS/km. For a 100 km line, the series reactance is 50 Ω and the total charging susceptance 329 µS, which at 230 kV draws \(230^2 \times 329 \times 10^{-6} = 17.4\) Mvar of reactive power, generated by the line itself.
Bundled conductors
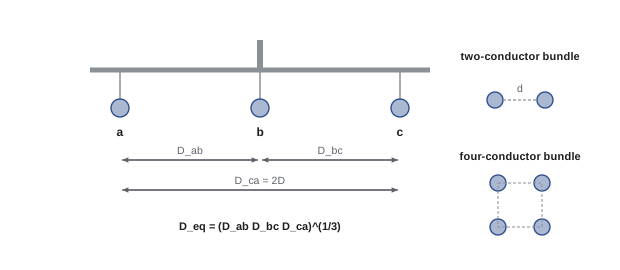
At 345 kV and above, each phase uses two to four (sometimes more) subconductors held apart by spacers, typically 0.3 to 0.5 m. Bundling increases the effective radius of the phase, which lowers inductance, raises capacitance (both increasing the power the line can carry, as shown below), and, most importantly, reduces the electric field at the conductor surface, limiting corona discharge, audible noise and radio interference. For a bundle of two subconductors at spacing \(d\), the GMR is \(\sqrt{D_s d}\), and for four, \(1.09\sqrt[4]{D_s d^3}\).
Line models
A line is described by its series impedance \(z = r + jx\) and shunt admittance \(y = jb\) per unit length. For analysis, the relationship between sending-end and receiving-end quantities is written with the two-port ABCD parameters:
with per-phase line-to-neutral voltages. For a symmetrical line, \(A = D\), and \(AD - BC = 1\). Three models are used depending on length:
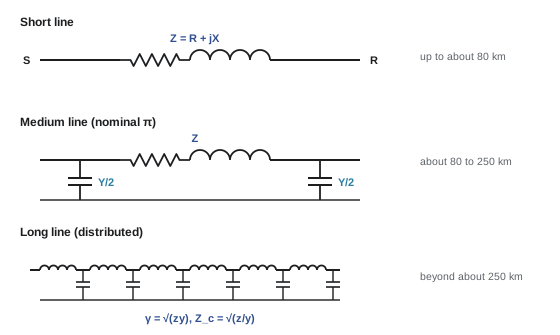
- Short line (up to about 80 km): shunt capacitance is neglected; the line is a series impedance \(Z = z\ell\), with \(A = D = 1\), \(B = Z\) and \(C = 0\).
- Medium line (about 80 to 250 km): the nominal π model places half the total shunt admittance \(Y = y\ell\) at each end, giving \(A = D = 1 + ZY/2\), \(B = Z\) and \(C = Y(1 + ZY/4)\).
- Long line (beyond about 250 km): the distributed nature must be modelled exactly, using the propagation constant \(\gamma = \sqrt{zy}\) and the characteristic impedance \(Z_c = \sqrt{z/y}\):
The exact model can also be represented by an equivalent π circuit with slightly corrected element values, which is how load flow programs model long lines.
import numpy as np

f = 60.0
r, x, b = 0.025, 0.33, 5.0e-6           # ohm/km, ohm/km, S/km (500 kV line, bundled conductors)
z, y = r + 1j * x, 1j * b
Zc = np.sqrt(z / y); gamma = np.sqrt(z * y)
V_LL = 500e3
print(f"characteristic impedance |Zc| = {abs(Zc):.0f} ohm,  SIL = {V_LL ** 2 / abs(Zc) / 1e6:.0f} MW")

def abcd_exact(L):
    gl = gamma * L
    return np.cosh(gl), Zc * np.sinh(gl), np.sinh(gl) / Zc, np.cosh(gl)

def abcd_pi(L):                          # nominal pi
    Z, Y = z * L, y * L
    return 1 + Z * Y / 2, Z, Y * (1 + Z * Y / 4), 1 + Z * Y / 2

for L in [100, 300, 600]:
    A, B, C, D = abcd_exact(L)
    Ap, Bp, Cp, Dp = abcd_pi(L)
    print(f"{L:4d} km: exact A = {A:.4f}  pi A = {Ap:.4f}   exact |B| = {abs(B):6.1f}  pi |B| = {abs(Bp):6.1f} ohm"
          f"   open-circuit Vr/Vs = {1 / abs(A):.3f}")

# receiving-end voltage for 300 km with |Vs| = 1.0 pu, unity-power-factor loads
from scipy.optimize import brentq
L = 300
A, B, C, D = abcd_exact(L)
Vs = V_LL / np.sqrt(3)
for P_MW in [0, 500, 972, 1200, 1500]:
    P1 = P_MW * 1e6 / 3                              # per phase
    g = lambda Vr: abs(A * Vr + B * P1 / Vr) - Vs    # Vr taken as the angle reference
    grid = np.linspace(1.6 * Vs, 0.2 * Vs, 400)      # search downward for the upper (normal) solution
    vals = np.array([g(v) for v in grid])
    idx = np.where(np.sign(vals[:-1]) != np.sign(vals[1:]))[0]
    if len(idx) == 0:
        print(f"P = {P_MW:4d} MW: no solution, beyond the maximum power the line can deliver")
        continue
    Vr = brentq(g, grid[idx[0] + 1], grid[idx[0]])
    delta = np.degrees(np.angle(A * Vr + B * P1 / Vr))
print(f"P = {P_MW:4d} MW: receiving voltage = {Vr / Vs:.3f} pu, angle across line = {delta:5.1f} deg")characteristic impedance |Zc| = 257 ohm, SIL = 972 MW 100 km: exact A = 0.9918+0.0006j pi A = 0.9918+0.0006j exact |B| = 33.0 pi |B| = 33.1 ohm open-circuit Vr/Vs = 1.008 300 km: exact A = 0.9267+0.0055j pi A = 0.9257+0.0056j exact |B| = 96.8 pi |B| = 99.3 ohm open-circuit Vr/Vs = 1.079 600 km: exact A = 0.7173+0.0203j pi A = 0.7030+0.0225j exact |B| = 179.5 pi |B| = 198.6 ohm open-circuit Vr/Vs = 1.393 P = 0 MW: receiving voltage = 1.079 pu, angle across line = 0.3 deg P = 500 MW: receiving voltage = 1.045 pu, angle across line = 11.0 deg P = 972 MW: receiving voltage = 0.959 pu, angle across line = 23.4 deg P = 1200 MW: receiving voltage = 0.865 pu, angle across line = 32.7 deg P = 1500 MW: no solution, beyond the maximum power the line can deliver
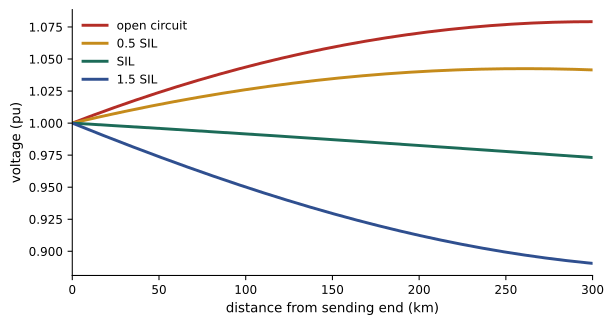
For 100 km the nominal π model is essentially exact; at 300 km it is within a few percent; at 600 km its errors exceed 10% and the exact model is needed. Unloaded, the receiving voltage of the 300 km line rises 8% above the sending voltage, and of the 600 km line 39%. Under load at unity power factor, the receiving voltage falls, reaching about 0.96 pu at the surge impedance loading of 972 MW (slightly below 1.0 because the line has resistance), and no solution exists at 1500 MW: the line simply cannot deliver that much power without voltage support.
Surge impedance loading and the Ferranti effect
If a lossless line is terminated in its characteristic impedance \(Z_c\), the reactive power generated by the shunt capacitance exactly balances the reactive power absorbed by the series inductance, and the voltage magnitude is the same all along the line. The power delivered in this condition is the surge impedance loading:
Overhead lines have characteristic impedances of about 250 to 400 Ω (lower for bundled conductors), giving SILs of roughly 40 MW at 138 kV, 140 MW at 230 kV, 400 MW at 345 kV, 950 MW at 500 kV and 2200 MW at 765 kV. Below SIL, a line generates net reactive power and voltages tend to rise; above SIL, it absorbs reactive power and voltages fall.
The extreme case is an open-circuited line. The charging current flowing through the series inductance raises the receiving voltage to \(V_R = V_S/\cos\beta\ell\) for a lossless line, where \(\beta = 2\pi/\lambda\) and the wavelength at 60 Hz is about 5000 km. This voltage rise on lightly loaded long lines is the Ferranti effect, and it is controlled with shunt reactors switched in at light load.
Power transfer and loadability
For a line modelled by its series reactance \(X\) (neglecting resistance and shunt capacitance), with sending and receiving voltages \(V_S\angle\delta\) and \(V_R\angle 0\), the real power transferred is
Real power flows from the leading to the lagging end, governed by the angle \(\delta\); it reaches a theoretical maximum \(V_SV_R/X\) at \(\delta = 90°\), the steady-state stability limit. Reactive power flows from the higher voltage magnitude to the lower, and for small angles \(Q_R \approx V_R(V_S - V_R)/X\). This decoupling, angles for real power and magnitudes for reactive power, is the foundation of the fast load flow methods in Lesson 6.
Worked problem
Maximum power and operating angle
A 345 kV line has a series reactance of 80 Ω, and both ends are held at 1.0 pu (345 kV). What is the theoretical maximum power transfer? What angle is needed to transfer 800 MW?
Show solution
- \(P_{\max} = V^2/X = 345^2/80 = 1488\) MW (using line-to-line kV and MW directly).
- \(\sin\delta = 800/1488 = 0.538\), so \(\delta = 32.5°\).
Answer: A maximum of about 1490 MW and an angle of 32.5° for 800 MW. Operators keep angles across lines well below 90°, typically under 30 to 45°, to leave a margin for disturbances, so the practical limit is substantially lower than the theoretical one.
Limits on line loading
The power a line can carry is limited by different factors depending on its length:
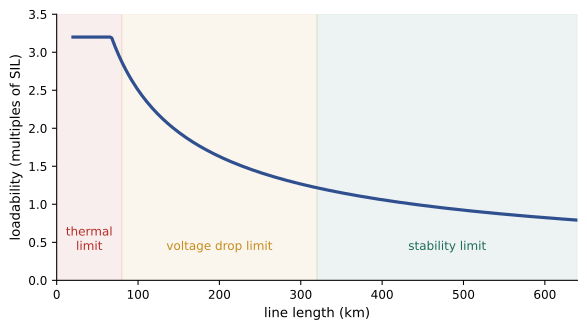
- Thermal limit: conductor temperature, which sets sag and clearance to ground, and annealing of aluminium. It governs short lines (up to about 80 km). Ratings depend on ambient temperature and wind, and dynamic line ratings that use real-time weather can safely increase capacity.
- Voltage drop limit: the receiving voltage must stay within about 5% of nominal. It governs medium lines.
- Stability limit: the angle across the line must stay well below 90°, with a margin of 30% or more. It governs long lines.
The St. Clair curve summarizes these as loadability in multiples of SIL: roughly 3 SIL at 80 km, 1.5 SIL at 300 km and about 1 SIL at 500 km for uncompensated lines.
Compensation and FACTS
Long lines are compensated to raise their capacity and control voltage:
- Series capacitors cancel part of the line reactance, commonly 30 to 70%. Since \(P_{\max} = V_SV_R/X\), 50% compensation doubles the theoretical transfer limit. Series capacitors require protection against overvoltage during faults and studies for subsynchronous resonance with nearby turbine generators.
- Shunt reactors absorb the charging reactive power at light load, controlling the Ferranti rise; shunt capacitors supply reactive power at heavy load, supporting voltage.
- Flexible AC transmission systems (FACTS) use power electronics for fast, continuous control: static var compensators and STATCOMs regulate voltage by injecting or absorbing reactive power, and thyristor-controlled series capacitors and unified power flow controllers adjust line impedance or angle to direct power flows.
Worked problem
Effect of series compensation
The 345 kV line of the previous example (80 Ω) receives 40% series compensation. What are the new maximum transfer and the angle needed for 800 MW?
Show solution
- Net reactance: \(80 \times (1 - 0.4) = 48\) Ω.
- \(P_{\max} = 345^2/48 = 2480\) MW; \(\sin\delta = 800/2480 = 0.323\), \(\delta = 18.8°\).
Answer: The maximum rises to about 2480 MW, and 800 MW needs only 18.8°, leaving a much larger stability margin. This is often far cheaper than building a new line.
Underground cables
Underground cables are used in cities, at water crossings and where overhead lines cannot be permitted. Their conductors are close together and surrounded by insulation with a relative permittivity of 2.3 to 4, so their capacitance is 20 to 50 times that of an overhead line and their characteristic impedance only 30 to 60 Ω. The charging current is large: a 230 kV cable may draw 10 to 20 A per kilometre, so beyond a few tens of kilometres the charging current alone approaches the thermal rating, leaving no capacity for load unless shunt reactors are installed along the route. This is why long cable connections, such as offshore wind farms and undersea interconnectors, use HVDC. Cables also cost five to fifteen times as much as overhead lines, take longer to repair, and have thermal ratings limited by the soil's ability to carry away heat.
Lesson 5 builds on the reactive behaviour of lines described here to study voltage control and voltage stability, and Lesson 8 uses the power-angle relation in stability analysis.
Common mistakes
MistakeUsing the short-line model for long lines.
InsteadInclude shunt capacitance beyond about 80 km and use the exact model beyond about 250 km.
MistakeExpecting the receiving voltage of a lightly loaded line to be below the sending voltage.
InsteadBelow SIL, line charging raises voltage (Ferranti effect); shunt reactors control it.
MistakeRating every line by its thermal limit.
InsteadMedium and long lines are limited by voltage drop and stability, as the St. Clair curve shows.
MistakeMixing line-to-line and line-to-neutral voltages in ABCD calculations.
InsteadUse per-phase line-to-neutral values, or per unit throughout.
MistakeTreating long AC cables like overhead lines.
InsteadCable charging current is very large; long cables need reactors or HVDC.
Summary and key terms
- Lines have series resistance and inductance and shunt capacitance, distributed along their length.
- L = 2×10⁻⁷ ln(D_eq/D_s) H/m; C = 2πε₀/ln(D_eq/r) F/m; bundling raises the effective radius.
- Short (series Z), medium (nominal π) and long (cosh, sinh) models apply by length.
- Characteristic impedance Z_c = √(z/y); SIL = V²/|Z_c|; below SIL voltages rise, above SIL they fall.
- The Ferranti effect raises the open-circuit receiving voltage to V_S/cos βℓ.
- P = V_S V_R sin δ / X: angles drive real power, magnitudes drive reactive power.
- Loadability is limited thermally (short lines), by voltage drop (medium) and by stability (long).
- Series capacitors, shunt reactors and capacitors, and FACTS devices raise capacity and control voltage.
- Cables have high capacitance; long cable links use HVDC.
- ACSR
- Aluminium conductor steel-reinforced.
- Transposition
- Rotating phase positions along a line to balance its parameters.
- Geometric mean distance
- The cube root of the product of the three phase spacings.
- Geometric mean radius
- The effective radius of a conductor for inductance calculations.
- Bundled conductors
- Multiple subconductors per phase that increase effective radius.
- Corona
- Partial discharge from conductors when the surface field is too high.
- ABCD parameters
- Two-port constants relating sending and receiving voltages and currents.
- Nominal π model
- Series impedance with half the shunt admittance at each end.
- Characteristic impedance
- √(z/y), the impedance seen by a wave travelling along the line.
- Surge impedance loading
- The load at which a line's reactive generation and absorption balance.
- Ferranti effect
- The rise of receiving-end voltage on a lightly loaded line.
- St. Clair curve
- Loadability of a line in multiples of SIL against length.
- Series compensation
- Capacitors in series with a line to cancel part of its reactance.
- FACTS
- Power electronic devices that control voltage and power flow on the transmission system.
Practice problems
Work each problem on paper first, then reveal the answer to check.
Phases are spaced 6 m, 6 m and 12 m. What is the GMD?
Show answer
(6 × 6 × 12)^(1/3) = 7.56 m.
With GMD 7.56 m and GMR 10 mm, what is the inductive reactance per km at 60 Hz?
Show answer
L = 2e-7 ln(756) = 1.326 µH/m; X = 0.500 Ω/km.
A two-subconductor bundle has D_s = 12 mm and spacing 0.45 m. What is the bundle GMR?
Show answer
√(0.012 × 0.45) = 73.5 mm.
A line has L = 1.0 mH/km and C = 11 nF/km. Estimate Z_c and the SIL at 345 kV.
Show answer
Z_c = √(1e-3/11e-9) = 302 Ω; SIL = 345²/302 = 394 MW.
Which model would you use for a 150 km line? For a 450 km line?
Show answer
Nominal π; exact long-line (or equivalent π).
Estimate the open-circuit receiving voltage of a lossless 400 km line at 60 Hz with 1.0 pu sending voltage.
Show answer
βℓ = 2π × 400/5000 = 0.503 rad; 1/cos(0.503) = 1.14 pu.
A 230 kV line with X = 60 Ω carries 300 MW with both ends at 1.0 pu. What is δ?
Show answer
P_max = 230²/60 = 882 MW; sin δ = 0.34; δ = 19.9°.
What limits the loading of a 30 km line? A 500 km line?
Show answer
Thermal limit; stability limit.
By what factor does 60% series compensation raise the theoretical maximum transfer?
Show answer
X becomes 0.4X, so P_max rises by 2.5.
Why do long submarine power connections use HVDC?
Show answer
AC cable charging current is so large it consumes the cable's thermal capacity; DC has no charging current in steady state.
Lesson quiz · 5 questions
Score 60% or more to complete this lesson.
Create a free account to save your progress, take quizzes and earn a certificate.