
DCT-220 · Lesson 11 of 12 · 21 min
Redundancy: N, N+1, 2N and distributed redundant
Every lesson in this course has mentioned redundancy: the two utility lines, the N+1 generators, the 2N UPS systems, the A and B sides to every rack. This lesson brings those ideas together. It explains the notation, compares the common designs, shows how to work out what each component carries in normal operation and after a failure, and explains the most useful tool a technician has for living with redundancy every day: knowing, at every moment, how much of it is left. DCT-110 introduced tiers and redundancy at a high level; here the focus is on the power plant itself.
The notation
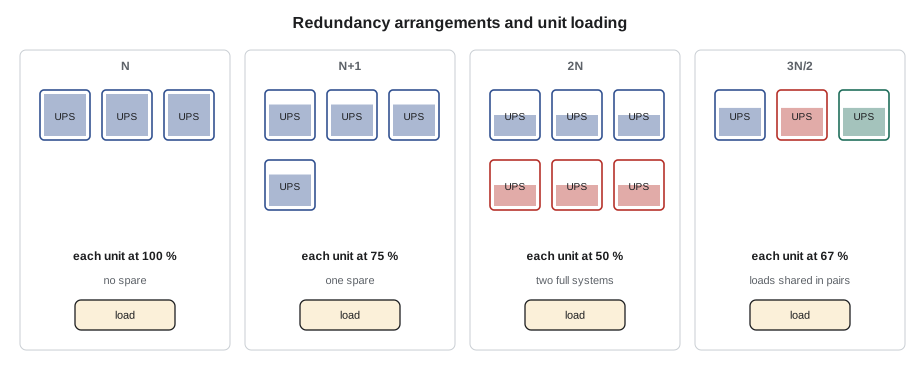
N is the capacity needed to carry the load, counted in units such as UPS modules, generators or cooling units. A design with exactly N has no spare: if any unit fails, the load cannot be fully carried. N+1 adds one spare unit, so one unit can fail or be serviced and the load is still carried. N+2 adds two. 2N provides two complete, independent systems, each able to carry the whole load. 2N+1 is two complete systems, each with a spare unit. Distributed redundant designs, sometimes written as 3N/2 or 4N/3, spread the load across three or more systems so that the loss of any one is absorbed by the others, without duplicating everything.
What redundancy protects against
Redundancy protects against two things: failures and maintenance. A failure is unplanned, such as a UPS module fault, a generator failing to start or a breaker tripping. Maintenance is planned, such as a UPS module replacement or a switchboard inspection. A system with N+1 redundancy can survive one failure or one piece of planned maintenance, but not a failure during maintenance. That is concurrent maintainability, the idea behind Uptime Institute's Tier III: every component and path can be taken out for maintenance without shutting down the IT load. Tier IV adds fault tolerance: the load survives a failure even while something else is out for maintenance, which in practice needs 2N or similar arrangements throughout.
Redundancy also has limits. Two systems that share something, such as a common cable route, a common control system or the same faulty firmware, can fail together. These are common-mode failures, and much of good design is about finding and removing them. A redundant plant that is not maintained also loses its redundancy quietly: a spare generator with a failed block heater, a UPS module with a failing fan or a breaker that will not close are all reductions in redundancy that nobody may notice until the day they matter.
Loads per unit in normal operation and after a failure
In an N+1 system of identical units sharing the load equally, each unit carries the load divided by the number of units. If one fails, the others share the load divided by one fewer. In a 2N system, each side carries about half the load in normal operation and the whole load if the other side fails. The code below works through Stonebridge's plant for Hall A.
# Loading per unit in normal operation and after one failure (illustrative Hall A figures)
def share(load_kw, units, unit_kw):
    return load_kw / units, load_kw / units / unit_kw * 100
systems = [
    # (name, load kW, units installed, unit rating kW, arrangement)
    ("Generators, Hall A block", 2600, 3, 2000, "N+1"),
    ("UPS-A2 modules (A side)", 600, 4, 500, "modules in one 2N side"),
    ("UPS-A2 + UPS-B2 (2N)", 1200, 2, 2000, "2N"),
    ("CRAH units, Hall A", 1200, 12, 140, "N+2"),
]
for name, load, n, unit, arr in systems:
    per, pct = share(load, n, unit)
    per_f, pct_f = share(load, n - 1, unit)
print(f"{name:28s} [{arr}] normal: {per:6.0f} kW per unit ({pct:3.0f} %); one unit lost: {per_f:6.0f} kW ({pct_f:3.0f} %)")Generators, Hall A block [N+1] normal: 867 kW per unit ( 43 %); one unit lost: 1300 kW ( 65 %) UPS-A2 modules (A side) [modules in one 2N side] normal: 150 kW per unit ( 30 %); one unit lost: 200 kW ( 40 %) UPS-A2 + UPS-B2 (2N) [2N] normal: 600 kW per unit ( 30 %); one unit lost: 1200 kW ( 60 %) CRAH units, Hall A [N+2] normal: 100 kW per unit ( 71 %); one unit lost: 109 kW ( 78 %)
Look at what the numbers mean. The Hall A generators carry 43 % each with all three running and 65 % with one lost, comfortably within rating. Each UPS-A2 module carries only 30 % in normal operation because the A side shares the hall's load with the B side; if the B side failed entirely, the A side would carry all 1,200 kW, 60 % per module, and could still lose one module and stay at 80 %. The 2N line shows the most important fact about 2N: each side runs at well under half its rating so that it can carry the whole load alone.
Why 2N is not simply twice as reliable
2N doubles the equipment, but its main value is independence. Two completely separate paths mean that most failures, and most maintenance, affect only one path. A technician can do work on the B side, with permits and lockouts, while the A side carries the racks, and a failure on the B side during that time does not matter because the B side is already out. What 2N cannot protect against is the loss of the A side while the B side is out for maintenance. That is why maintenance windows are short, carefully planned, and preceded by checks that the side carrying the load is healthy, as lesson 6 described.
2N is also only as good as the IT equipment's use of it. A dual-corded server with both cords on the same side, a single-corded switch, or a rack whose total load exceeds what one side can carry, as in lesson 9, all defeat 2N at the rack. In practice, a large share of the power-related outages in 2N data centres happen at the rack level, from mistakes in cords and loads, not from failures of UPS systems or generators.
Distributed redundant designs
Some operators use distributed redundant designs to reduce cost. In a 3N/2 design, three UPS systems each carry two thirds of their rating, and each rack is fed from two of the three. If one system fails, its load is split between the other two, which then run at full rating. The design uses fewer UPS systems than 2N for the same load, but the connections are more complex, the systems run at higher normal loads, and maintenance planning has to work out exactly which racks depend on which pairs of systems. Halls B and C at Stonebridge use a 4N/3 distributed redundant design built for the cloud tenant; Halls A and D use 2N.
# 4N/3 distributed redundant: four UPS systems, each rack fed from two of them (illustrative)
import itertools
systems = {"UPS-1": 2400, "UPS-2": 2400, "UPS-3": 2400, "UPS-4": 2400}   # ratings, kW
pairs = list(itertools.combinations(systems, 2))      # six possible A/B pairs
load_per_pair = 1200                                  # kW of racks on each pair, split half and half
load = {s: 0.0 for s in systems}
for a, b in pairs:
    load[a] += load_per_pair / 2; load[b] += load_per_pair / 2
print("Normal: " + ", ".join(f"{s} {kw:.0f} kW ({kw / systems[s] * 100:.0f} %)" for s, kw in load.items()))
failed = "UPS-3"
after = {s: 0.0 for s in systems if s != failed}
for a, b in pairs:
    if failed in (a, b):
        other = b if a == failed else a
        after[other] += load_per_pair            # the surviving system carries the whole pair
    else:
        after[a] += load_per_pair / 2; after[b] += load_per_pair / 2
print(f"{failed} lost: " + ", ".join(f"{s} {kw:.0f} kW ({kw / systems[s] * 100:.0f} %)" for s, kw in after.items()))Normal: UPS-1 1800 kW (75 %), UPS-2 1800 kW (75 %), UPS-3 1800 kW (75 %), UPS-4 1800 kW (75 %) UPS-3 lost: UPS-1 2400 kW (100 %), UPS-2 2400 kW (100 %), UPS-4 2400 kW (100 %)
Each of the four systems runs at 75 % normally, and at 100 % after one fails: the design works, but with no margin left. That is the trade-off of distributed redundancy: less equipment, higher normal loading, and much less room for growth or error. The capacity planners for Halls B and C watch these numbers closely.
The redundancy whiteboard
Every shift at Stonebridge starts with the redundancy whiteboard, a screen in the operations room and a physical board beside it, maintained by the shift lead, Dmitri. For each hall and each part of the plant it shows the designed redundancy and the present redundancy, in green, amber or red. Green means the design redundancy is available. Amber means some redundancy has been lost, for example a UPS module out of service in an N+1 system, or one utility line lost. Red means there is no redundancy left at that point: the next failure will affect the load.
| Plant | Design | Example of amber | Example of red |
|---|---|---|---|
| Utility | Two lines | One line out | Both lines out (on generator) |
| Generators (each block) | N+1 | One set out of service | Two sets out, or one out and another failing tests |
| UPS (Hall A) | 2N, N+1 modules per side | One module out on one side | One whole side on maintenance bypass |
| Distribution (Hall A) | 2N to every rack | A floor PDU of a pair out for work | Both of a pair affected |
| Cooling (Hall A) | N+2 CRAH | One unit out | Three units out |
The whiteboard is the gate for planned work: no work that reduces redundancy may start at a point already amber or red, unless the change approval specifically allows it. It is also the first thing anyone checks during an alarm. A technician who sees an unexpected change in the plant, a module offline, a breaker open or a generator in manual, reports it so that the board stays true. A whiteboard that shows green when the plant is really amber is worse than no whiteboard at all.
Single points of failure
A single point of failure is anything whose failure alone would drop the load. Good designs remove them from the paths to critical loads, but some remain, often in places that are easy to forget: a single control system that runs all the generators, a single fuel transfer pump, a shared emergency power off (EPO) circuit, a single busway feeding a row, or the single power supply in a customer's network switch. Part of a technician's value is noticing them. Stonebridge's operations team keeps a register of known single points of failure, with the controls in place for each, and adds to it whenever an incident or a walk-round finds a new one.
# Find racks whose power path has a single point of failure (illustrative inventory)
racks = {  # rack: (A-side source, B-side source, devices single-corded?)
    "A-22-03": ("PDU-A2-07", "PDU-B2-07", True),
    "A-22-05": ("PDU-A2-07", "PDU-B2-07", False),
    "A-31-03": ("RPP-A2-03", "RPP-B2-03", False),
    "A-36-07": ("PDU-A2-09", "PDU-A2-09", False),     # both cords from the same PDU
    "D-3-07":  ("BW-D3-A", "BW-D3-B", False),
}
for rack, (a, b, single) in racks.items():
    issues = []
    if a == b: issues.append(f"both cords on {a}")
    if single: issues.append("single-corded devices")
print(f"{rack}: " + ("; ".join(issues) + " -> single point of failure" if issues else "independent A and B paths"))A-22-03: single-corded devices -> single point of failure A-22-05: independent A and B paths A-31-03: independent A and B paths A-36-07: both cords on PDU-A2-09 -> single point of failure D-3-07: independent A and B paths
Redundancy and capacity are linked
Every redundancy claim depends on load. An N+1 generator plant becomes N when the load grows enough that all units are needed. A 2N UPS pair stops being 2N when either side's load exceeds what one system can carry. That is why capacity planning and redundancy are watched together, and why the planning limits used throughout this course, such as 40 % per side on 2N branches and 90 % per unit after a failure, are written as rules rather than left to judgement. When a customer asks for more power, the question is not only whether the branch can carry it, but whether every upstream redundancy claim stays true after it is added.
Worked problem
A morning check before UPS maintenance
UPS-B2's annual maintenance is scheduled for 06:00. At 05:30, Dmitri asks Jamal to check the whiteboard and the plant before the vendor arrives.
Show solution
- Utility: two lines in service. Green.
- Hall A generators: GEN-A1 and GEN-A2 in automatic, no alarms; GEN-A3 in manual with a ticket from yesterday's coolant hose repair, still open. Amber.
- UPS-A2, the side that will carry the load: four modules online, batteries normal, runtime 23.0 minutes at 600 kW. Green.
- Hall A distribution: no PDUs or branches out of service; branch monitoring shows no racks on one side only. Green.
- Jamal reports: the generator block is at N because GEN-A3 is in manual. The MOP for UPS-B2 says generator redundancy must be green before starting.
Answer: Dmitri calls the generator vendor, who confirms that GEN-A3's repair was completed but the closing paperwork was not, and that the set passed its run test. Roz inspects it and returns it to automatic at 05:52; the whiteboard turns green, and the maintenance starts on time. Without the check, Hall A's B side would have gone onto maintenance bypass with its generator plant one failure away from not starting enough sets.
Common mistakes
MistakeThinking N+1 survives a failure during maintenance.
InsteadIt survives one or the other; a failure during maintenance needs more redundancy.
MistakeCounting installed units instead of units actually available.
InsteadA unit in manual, failed or out for service is not redundancy.
MistakeAssuming 2N at the UPS means 2N at the rack.
InsteadCords, single-corded devices and rack loads decide whether the rack really has two paths.
MistakeLetting the whiteboard drift from reality.
InsteadReport every change in plant status so the board stays true.
MistakeTreating capacity and redundancy separately.
InsteadLoad growth quietly removes redundancy; check both together.
Summary and key terms
- N is the capacity needed; N+1 adds a spare unit; 2N provides two complete systems; distributed redundant designs spread load over three or more systems.
- Redundancy protects against failures and maintenance; Tier III needs concurrent maintainability, Tier IV fault tolerance.
- In 2N, each side runs below half its rating so it can carry the whole load alone.
- Distributed redundant designs save equipment but run at higher loads with less margin.
- The redundancy whiteboard shows present redundancy and gates planned work.
- Single points of failure, unmaintained spares and load growth all quietly reduce redundancy.
- N
- The number of units needed to carry the load.
- N+1
- The needed units plus one spare.
- 2N
- Two complete independent systems, each able to carry the whole load.
- Distributed redundant
- A design in which three or more systems share the load so that any one can fail.
- Concurrent maintainability
- The ability to take any component out for maintenance without shutting down the load.
- Single point of failure
- A component whose failure alone would interrupt the load.
Practice problems
Work each problem on paper first, then reveal the answer to check.
Three 2,000 kW generators carry 3,000 kW. What does each carry if one fails?
Show answer
1,500 kW, 75 % of rating.
Why does each side of a 2N UPS pair run at less than 50 % of its rating?
Show answer
So either side can carry the whole load if the other fails.
What does amber mean on the redundancy whiteboard?
Show answer
Some redundancy has been lost, but the load is still protected against the next single failure at that point.
Give two examples of single points of failure that are easy to miss.
Show answer
A shared generator control system, a single fuel transfer pump, a shared EPO circuit, a single-corded network switch.
Lesson quiz · 5 questions
Score 60% or more to complete this lesson.
Create a free account to save your progress, take quizzes and earn a certificate.