
DCE-440 · Lesson 2 of 12 · 32 min
Fire dynamics and risk assessment
Fire protection design starts with two questions: how would a fire in this space start and grow, and how much does it matter if it does? The first is the subject of fire dynamics, the science of how materials ignite, burn, release heat and produce smoke. The second is the subject of risk assessment, which weighs how likely each kind of fire is against its consequences for people, equipment and the business. Together they explain why data centres invest so heavily in early detection, why a fire of only a few kilowatts can still cause a costly outage, and why the protection chosen for a battery room differs from that chosen for an office. This lesson introduces the quantities that fire engineers use, the fuels found in data centres, how fires develop in rooms, and how to structure a fire risk assessment that guides the rest of the design.
The chemistry of fire
A flaming fire needs four things at once: fuel, oxygen, heat and an uninterrupted chain of chemical reactions in the flame. This is often drawn as the fire tetrahedron, an extension of the older fire triangle. Every extinguishing method removes one side: water and halocarbon agents remove heat, inert gases reduce oxygen, de-energizing a faulty circuit removes the heat source that keeps an electrical fire going, and some chemical agents interrupt the flame reactions. Removing combustible material from a data hall reduces the fuel available.
Solid materials do not burn directly. Heat first decomposes them into flammable gases (a process called pyrolysis), and it is these gases that mix with air and burn as flame. Smouldering is a slower, flameless combustion on the surface of a porous or charring material, such as the insulation of an overheated cable or a circuit board. Smouldering produces little heat but a lot of smoke and carbon monoxide relative to its size, and it can transition to flaming when enough heat builds up or air supply increases.
Ignition sources in data centres are dominated by electrical faults:
- Failing components in power supplies, UPS modules, power distribution units and servers (capacitors, transformers, switching transistors).
- High-resistance connections in busways, breakers and cable lugs, which heat up under load.
- Damaged or overloaded cables, including cables crushed during installation or run in overfilled trays.
- Lithium-ion and other batteries, through internal short circuits or abuse (Lesson 7).
- Hot work such as welding, cutting and soldering during construction and maintenance (Lesson 11).
- Generators, fuel systems and exhaust, and occasionally arson or exposure to a fire next door.
Heat release rate
The single most important quantity in fire dynamics is the heat release rate (HRR), the rate at which a fire produces energy, measured in kilowatts (kW) or megawatts (MW). The HRR determines how hot the gases become, how fast smoke is produced, whether nearby items ignite, and whether detectors and sprinklers operate. A small smouldering fault in a power supply may release well under 1 kW; a wastebasket fire about 50 to 150 kW; a burning upholstered chair several hundred kilowatts to over 1 MW. Tests on loaded server cabinets have measured peak heat release rates from a few hundred kilowatts to more than 1 MW, depending on the equipment, the plastics in it and the ventilation.
| Item | Typical peak heat release rate |
|---|---|
| Overheating power supply or circuit board (smouldering) | Below 1 kW |
| Small wastebasket or packaging | 50 to 150 kW |
| Office workstation | 1 to 3 MW |
| Loaded server cabinet | A few hundred kW to over 1 MW |
| Cable tray, per metre of burning length | Tens to a few hundred kW, depending on cable type and loading |
| Lithium-ion battery rack in thermal runaway | Several hundred kW to several MW, plus flammable gases |
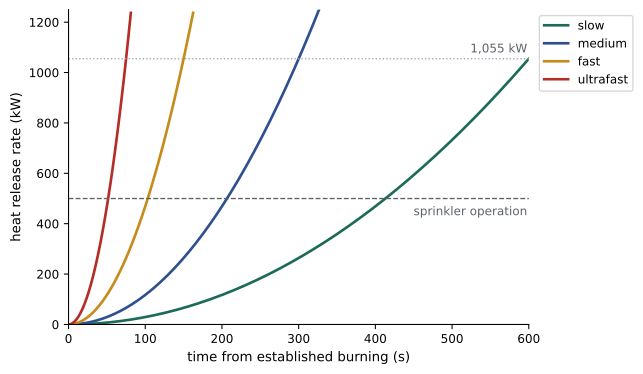
Many fires grow at a rate that is approximately proportional to the square of time after an initial incubation period. This t-squared fire model is widely used in fire engineering:
where \(\dot{Q}\) is the heat release rate in kW, \(t\) the time in seconds from the start of established burning, and \(\alpha\) the fire growth coefficient. Standard values are slow (0.00293 kW/s²), medium (0.01172), fast (0.0469) and ultrafast (0.1876), chosen so that the fire reaches 1,055 kW (1,000 Btu/s) in 600, 300, 150 and 75 seconds respectively. A smouldering electrical fault may sit at a very low HRR for a long time before flaming growth begins, and the t-squared curve then describes the flaming phase.
import math

# t-squared fire growth: Q = alpha * t**2, with Q in kW and t in seconds
alphas = {"slow": 0.00293, "medium": 0.01172, "fast": 0.0469, "ultrafast": 0.1876}
targets = [10, 100, 500, 1000]                  # heat release rates of interest, kW

print("growth     " + "".join(f"{q:>8d} kW" for q in targets))
for name, a in alphas.items():
    times = [math.sqrt(q / a) for q in targets]
    print(f"{name:<10} " + "".join(f"{t:>9.0f} s" for t in times))

print()
# Time gained by detecting at 10 kW instead of 500 kW (an illustrative sprinkler operation size)
for name, a in alphas.items():
    gain = math.sqrt(500 / a) - math.sqrt(10 / a)
print(f"{name:<10} detection at 10 kW gains {gain:4.0f} s ({gain / 60:.1f} min)")growth 10 kW 100 kW 500 kW 1000 kW slow 58 s 185 s 413 s 584 s medium 29 s 92 s 207 s 292 s fast 15 s 46 s 103 s 146 s ultrafast 7 s 23 s 52 s 73 s slow detection at 10 kW gains 355 s (5.9 min) medium detection at 10 kW gains 177 s (3.0 min) fast detection at 10 kW gains 89 s (1.5 min) ultrafast detection at 10 kW gains 44 s (0.7 min)
The output shows why early detection matters. Even a fast-growing fire takes about 15 seconds to grow from nothing to 10 kW but nearly two minutes to reach 500 kW, a size at which ceiling sprinklers in a typical room might begin to operate. A slow fire gives about six minutes between these points. Detection that responds at a few kilowatts, as aspirating systems often do, therefore gives staff time to find and de-energize the faulty equipment before the fire grows. In a real data hall, the period before flaming begins, when an overheating component is only smouldering, may add minutes or hours of further warning.
Fuels in a data centre
Although a data hall looks clean and orderly, it holds a substantial amount of combustible material. Servers and network equipment contain plastics in housings, fans, connectors and circuit boards; cables have plastic insulation and jackets; racks may carry plastic blanking panels and cable managers; and containment systems may include plastic curtains or panels. Packaging, if allowed into the hall, adds cardboard, foam and plastic film.
The quantity of combustible material is described by the fuel load, the total heat that would be released if everything burned, and by the fuel load density, the fuel load per unit floor area in megajoules per square metre (MJ/m²). The fuel load is the sum of each material's mass times its heat of combustion, which is about 15 to 20 MJ/kg for wood and paper and 20 to 45 MJ/kg for common plastics.
Worked problem
Fuel load of a data hall bay
A 100 m² bay of a data hall contains 20 server racks. Each rack holds about 40 kg of plastics in equipment and cable management with an average heat of combustion of 30 MJ/kg. Cables in overhead trays add 300 kg of insulation and jacket material at 25 MJ/kg. Estimate the fuel load density.
Show solution
- Racks: \(20 \times 40 \times 30 = 24{,}000\) MJ.
- Cables: \(300 \times 25 = 7{,}500\) MJ.
- Total: \(31{,}500\) MJ over 100 m² gives \(315\) MJ/m².
Answer: About 315 MJ/m², similar to many office occupancies. Not all of this would burn in a real fire, especially with flame-retardant materials, but the figure shows that a data hall is far from non-combustible. Removing packaging and abandoned cables, and choosing cables with low flame spread, reduces the fuel load directly.
Cable flame tests are a key control on fuel in data centres. In Canada, cables are tested to CSA C22.2 No. 0.3 and marked with ratings such as FT4 (vertical flame test, used for most building wiring and cable in trays) and FT6 (horizontal test with limits on flame spread and smoke, required for cables in plenums). Low-smoke zero-halogen (LSZH) cables, which release little smoke and no hydrogen chloride when burned, are often specified in critical rooms even where not required.
Smoke, toxicity and corrosion
In most building fires, smoke rather than heat is what kills people, through reduced visibility and toxic gases, chiefly carbon monoxide and hydrogen cyanide. In a data centre, smoke is also the main cause of equipment damage. Burning plastics produce soot particles and acidic gases. Polyvinyl chloride (PVC), common in cable jackets, releases hydrogen chloride as it decomposes; this gas combines with moisture to form hydrochloric acid, which deposits on circuit boards and connectors and corrodes them over the following days and weeks. Fluorinated plastics and halocarbon suppression agents can produce hydrogen fluoride.
As a result, a fire that is small in heat terms can damage equipment far from its origin, because the cooling system carries smoke through the whole hall. Restoration after even a modest fire may require specialist cleaning of every affected server, replacement of equipment that has been exposed to corrosive deposits, and testing of the air for residual contamination. Insurers and restoration firms treat prompt action, such as reducing humidity and starting cleaning within hours, as important to limit corrosion.
Smoke movement in data halls is dominated by the cooling airflow rather than by buoyancy, at least while the cooling runs and the fire is small. This dilutes smoke, which makes detection harder (Lesson 3), but it also spreads contamination widely. Decisions about whether to keep cooling running or shut it down during a fire are part of the fire strategy: shutting down cooling stops smoke spreading and helps gaseous agents hold, but it also leaves equipment to overheat if it remains powered.
How fires develop in rooms
A fire in a room passes through recognizable phases. In the growth phase, hot gases rise in a plume, spread across the ceiling and form a hot upper layer that deepens as the fire grows. If the upper layer reaches about 500 to 600 °C, radiation from it can ignite every exposed combustible in the room almost at once. This transition, called flashover, marks the change from a fire involving one item to a fully developed room fire, and it is generally considered unsurvivable for anyone still in the room. After flashover, burning is usually limited by the air that can enter through openings (ventilation-controlled), until the fuel is consumed and the fire decays.
A simple estimate of the heat release rate needed for flashover in a room is Thomas's correlation:
where \(\dot{Q}_{fo}\) is in kW, \(A_T\) is the total internal surface area of the room excluding openings (m²), \(A_o\) the area of the ventilation opening (m²) and \(H_o\) its height (m).
Worked problem
Flashover in a battery room
A UPS battery room measures 6 m by 5 m with a 3 m ceiling, and has one door 1.0 m wide and 2.1 m high, assumed open. Estimate the heat release rate needed to cause flashover.
Show solution
- Surface area: floor and ceiling \(2 \times 30 = 60\), walls \(2 \times 18 + 2 \times 15 = 66\); total 126 m², minus the 2.1 m² door: \(A_T = 123.9\) m².
- Opening term: \(378 \times 2.1 \times \sqrt{2.1} = 378 \times 2.1 \times 1.449 = 1{,}150\) kW.
- \(\dot{Q}_{fo} = 7.8 \times 123.9 + 1{,}150 = 966 + 1{,}150 \approx 2{,}120\) kW.
Answer: About 2.1 MW. A lithium-ion battery rack in thermal runaway can approach or exceed this, so a battery fire that is not controlled early could bring the room to flashover, which is one reason for 2-hour separations around battery rooms (Lesson 1) and the layered protection of Lesson 7. The correlation is approximate; detailed analysis uses zone or computational fluid dynamics models.
Large data halls rarely reach flashover because of their volume and high ceilings, but a fire involving a row of racks or cable trays could still spread along the row. Rated separations between halls limit how much capacity one fire can take out.
Fire risk assessment
Risk combines the likelihood of an event with its consequences. A fire risk assessment for a data centre identifies plausible fire scenarios, estimates how often each might occur and what it would cost, and uses the result to decide which protection measures are justified. NFPA 75 asks owners to base protection decisions on a risk assessment that considers life safety, the value of equipment, the effect of an outage on the business, and the exposure to and from other occupancies. Insurers perform their own assessments, and their recommendations often drive protection beyond code minimums.
A typical assessment proceeds in steps:
- Define the facility, its occupancy, its critical systems and what the business needs from it (for example, the maximum tolerable outage).
- Identify hazards and fire scenarios: an electrical fire in a rack, a cable tray fire, a UPS or battery fire, a generator fuel fire, a fire in an adjoining building, arson, a fire during construction.
- Estimate the frequency of each scenario, using industry data, insurer loss records and judgement.
- Estimate consequences: injuries, damaged equipment, outage hours and their cost, data loss, contractual penalties and reputation.
- Rank the risks and evaluate protection options for those that are not acceptable.
- Record the assessment, and review it when the facility changes.
Qualitative assessments place each scenario on a risk matrix, with likelihood on one axis and consequence on the other, each in four or five categories. Quantitative assessments estimate an expected annual loss, the sum over scenarios of frequency times consequence, and compare it with the annualized cost of protection. Both approaches depend on uncertain estimates, so a sensitivity check (what if the frequency is ten times higher?) is good practice.
| Likelihood / consequence | Minor | Moderate | Major | Severe |
|---|---|---|---|---|
| Likely | Medium | High | Extreme | Extreme |
| Possible | Low | Medium | High | Extreme |
| Unlikely | Low | Low | Medium | High |
| Rare | Low | Low | Medium | High |
# Expected annual loss (EAL) for fire scenarios in a data centre
# name, frequency (per year), direct damage ($), outage (hours), cost of outage ($ per hour)
scenarios = [
    ("Rack electrical fire, contained", 0.05, 150_000, 2, 100_000),
    ("Cable tray fire in data hall", 0.005, 2_000_000, 24, 100_000),
    ("UPS battery room fire", 0.004, 6_000_000, 120, 100_000),
    ("Generator or fuel fire", 0.002, 1_500_000, 8, 100_000),
    ("Fire during construction work", 0.01, 500_000, 0, 100_000),
]

def eal(rows):
    total = 0
    for name, f, damage, hours, rate in rows:
        loss = damage + hours * rate
        total += f * loss
        print(f"{name:<32} loss ${loss / 1e6:5.2f}M x {f:<6} = ${f * loss:>9,.0f} per year")
    label = "Total expected annual loss"
    print(f"{label:<32} ${total:,.0f}")
    return total

print("Baseline")
base = eal(scenarios)

# Mitigation for the battery room: off-gas detection and better separation
# assumed to halve the frequency and cut the outage to 24 hours and the damage to $2M
improved = [r if r[0] != "UPS battery room fire" else (r[0], 0.002, 2_000_000, 24, r[4]) for r in scenarios]
print()
print("With battery room mitigation")
new = eal(improved)
cost = 60_000                                   # annualized capital and maintenance, $ per year
print(f"Reduction ${base - new:,.0f} per year against a cost of ${cost:,} per year")Baseline Rack electrical fire, contained loss $ 0.35M x 0.05 = $ 17,500 per year Cable tray fire in data hall loss $ 4.40M x 0.005 = $ 22,000 per year UPS battery room fire loss $18.00M x 0.004 = $ 72,000 per year Generator or fuel fire loss $ 2.30M x 0.002 = $ 4,600 per year Fire during construction work loss $ 0.50M x 0.01 = $ 5,000 per year Total expected annual loss $121,100 With battery room mitigation Rack electrical fire, contained loss $ 0.35M x 0.05 = $ 17,500 per year Cable tray fire in data hall loss $ 4.40M x 0.005 = $ 22,000 per year UPS battery room fire loss $ 4.40M x 0.002 = $ 8,800 per year Generator or fuel fire loss $ 2.30M x 0.002 = $ 4,600 per year Fire during construction work loss $ 0.50M x 0.01 = $ 5,000 per year Total expected annual loss $57,900 Reduction $63,200 per year against a cost of $60,000 per year
In this example, the battery room fire dominates the expected loss despite being rarer than a rack fire, because its consequence is so large. A mitigation costing $60,000 a year in annualized capital and maintenance reduces the expected loss by slightly more than its cost, so it pays for itself on expected financial loss alone, before counting the benefits for life safety and reputation, or allowing for the possibility that the battery fire frequency has been underestimated. If the frequency were twice the assumed value, the reduction would be about twice as large. Results like these explain why battery rooms receive particular attention in modern data centres.
Defence in depth
No single measure can be relied upon to prevent loss from fire. Data centre fire strategies use several independent layers, so that the failure of one is caught by the next:
- Prevention: equipment quality, electrical maintenance and thermography, cable management, control of combustibles and hot work.
- Early detection: very sensitive smoke detection and monitoring of equipment temperatures and battery management systems.
- Response: alarms, trained staff who investigate and de-energize equipment, and notification of the fire department.
- Suppression: sprinklers, clean agents or water mist to control or extinguish a growing fire.
- Containment: fire separations, fire-stopping and dampers that confine a fire to one compartment.
- Recovery: redundancy in other compartments or sites, backups, and a plan for cleaning and restoration.
The rest of this course examines these layers in turn, and Lesson 12 brings them together in a performance-based design.
Common mistakes
MistakeTreating a data hall as non-combustible because it contains mostly metal racks.
InsteadAccount for plastics in equipment and cables; fuel load densities are comparable to offices.
MistakeJudging a fire's importance only by its size in kilowatts.
InsteadSmall fires can cause major outages through smoke, corrosion and power shutdowns.
MistakeUsing a single frequency estimate without testing its sensitivity.
InsteadCheck how conclusions change if frequencies or consequences are much higher or lower.
MistakeAssessing risk once at design and never again.
InsteadReview the assessment when equipment, batteries, occupancy or business needs change.
MistakeRelying on one protection layer.
InsteadCombine prevention, detection, response, suppression, containment and recovery.
Summary and key terms
- Fire needs fuel, oxygen, heat and a chain reaction; extinguishing methods remove one of these.
- Electrical faults are the main ignition source in data centres; many begin by smouldering.
- Heat release rate is the key fire quantity; t-squared growth gives Q = αt² with standard α values.
- Data halls carry substantial fuel in equipment plastics and cables; cable flame ratings limit it.
- Smoke and corrosive gases such as hydrogen chloride damage equipment far from a small fire.
- Flashover marks the transition to a fully developed room fire; Thomas's correlation estimates its HRR.
- Risk assessment weighs frequency against consequence and justifies protection layers.
- Fire tetrahedron
- Fuel, oxygen, heat and chain reaction, all needed for flaming combustion.
- Pyrolysis
- Thermal decomposition of a solid into flammable gases.
- Smouldering
- Slow, flameless surface combustion.
- Heat release rate (HRR)
- The rate at which a fire releases energy, in kW or MW.
- t-squared fire
- A fire whose heat release rate grows with the square of time.
- Fuel load density
- Total heat of combustion of contents per unit floor area.
- Flashover
- Rapid transition to a fire involving all combustibles in a room.
- Ventilation-controlled fire
- A fire limited by the air supply rather than by fuel.
- Risk matrix
- A grid ranking scenarios by likelihood and consequence.
- Expected annual loss
- The sum of scenario frequencies multiplied by their consequences.
Practice problems
Work each problem on paper first, then reveal the answer to check.
Which side of the fire tetrahedron do inert gas agents remove?
Show answer
Oxygen.
Why can smouldering fires be dangerous even though they release little heat?
Show answer
They produce smoke and carbon monoxide and can transition to flaming.
How long does a medium t-squared fire take to reach 500 kW?
Show answer
\(\sqrt{500/0.01172} \approx 207\) s.
What α value reaches 1,055 kW in 150 s?
Show answer
Fast, 0.0469 kW/s².
10 racks with 50 kg of plastics at 30 MJ/kg in 60 m². Fuel load density?
Show answer
15,000 MJ / 60 m² = 250 MJ/m².
Why does PVC cable insulation matter for equipment damage?
Show answer
It releases hydrogen chloride that forms corrosive acid on electronics.
What upper-layer temperature is associated with flashover?
Show answer
About 500 to 600 °C.
Room 4 m × 4 m × 3 m with a 0.9 m × 2.1 m open door. Flashover HRR by Thomas?
Show answer
A_T = 32 + 48 − 1.89 = 78.1 m²; 7.8 × 78.1 + 378 × 1.89 × 1.449 = 609 + 1,035 ≈ 1,640 kW.
A scenario occurs 0.01 times a year and costs $2 million. Expected annual loss?
Show answer
$20,000 per year.
Name three layers of defence in depth.
Show answer
Any three of prevention, detection, response, suppression, containment and recovery.
Lesson quiz · 5 questions
Score 60% or more to complete this lesson.
Create a free account to save your progress, take quizzes and earn a certificate.