
DCE-430 · Lesson 11 of 12 · 27 min
Resilience: flood, extreme wind, vehicle and blast hazards
Building codes set minimum standards that protect life safety: a code-compliant building should not collapse in its design earthquake or wind, though it may be badly damaged. Data centres usually need more. Their owners want the facility to keep operating, or at least to recover within hours, after events that codes treat as acceptable to damage, and they face threats that codes barely address, such as deliberate vehicle attacks and explosions. Lesson 7 covered the code-level design for snow, wind and earthquake. This lesson considers resilience more broadly: setting performance objectives beyond the code, designing for floods with climate change, extreme winds and tornadoes, wildfire, hostile vehicles and blast, and the role of site layout and redundancy in surviving events that the structure alone cannot resist.
Performance objectives beyond the code
Resilience design starts with explicit objectives. For each hazard, the owner and design team agree on a hazard level (how rare an event to design for) and a performance level (what condition the facility should be in afterwards):
| Performance level | Meaning | Typical use |
|---|---|---|
| Life safety | occupants can evacuate; building may be unusable | code minimum for ordinary buildings |
| Immediate occupancy | building is safe to occupy with minor repairs | important buildings |
| Operational (functional) | building and its critical systems keep working | post-disaster facilities, critical data centres |
Achieving operational performance requires protecting not only the structure but the nonstructural components and systems: equipment anchorage, piping, cable trays, ceilings, cooling, power, fuel supply and communications, along with the staff and supplies to run the facility for days if the surrounding community is disrupted. A data centre whose structure survives an earthquake but whose chillers fall off their supports, or whose fuel deliveries stop, has not achieved operational performance.
In Canada, the NBC assigns post-disaster buildings the highest importance category, with higher design loads and requirements for operational performance after earthquakes. Data centres are not automatically post-disaster buildings, but owners of critical facilities often design to post-disaster or high importance levels voluntarily, and CSA S832 gives guidance on seismic risk reduction of operational and functional components.
Thinking in probabilities
Design events are described by their return period: a 100-year flood has a 1% chance of being equalled or exceeded in any year. The chance of experiencing it at least once over a facility's life is much higher than many people assume:
import numpy as np

# Probability that a design event is equalled or exceeded at least once during a facility life
for T in (100, 200, 500, 1000):
    for n in (25, 50):
        p = 1 - (1 - 1 / T) ** n
        print(f"{T:4d}-year event over {n} years: {p:5.1%} chance of at least one occurrence")
# Flood depth-damage: a data hall floor 0.3 m vs 1.0 m above the 100-year flood level
# Illustrative river: each e-fold increase in return period above 100 years raises the flood level by 0.35 m (Gumbel-type tail)
scale = 0.35
for freeboard in (0.3, 0.6, 1.0):
    T_floor = 100 * np.exp(freeboard / scale)
    p50 = 1 - (1 - 1 / T_floor) ** 50
print(f"floor {freeboard:.1f} m above the 100-year flood level: reached about once in {T_floor:,.0f} years ({p50:.1%} over 50 years)")100-year event over 25 years: 22.2% chance of at least one occurrence 100-year event over 50 years: 39.5% chance of at least one occurrence 200-year event over 25 years: 11.8% chance of at least one occurrence 200-year event over 50 years: 22.2% chance of at least one occurrence 500-year event over 25 years: 4.9% chance of at least one occurrence 500-year event over 50 years: 9.5% chance of at least one occurrence 1000-year event over 25 years: 2.5% chance of at least one occurrence 1000-year event over 50 years: 4.9% chance of at least one occurrence floor 0.3 m above the 100-year flood level: reached about once in 236 years (19.2% over 50 years) floor 0.6 m above the 100-year flood level: reached about once in 555 years (8.6% over 50 years) floor 1.0 m above the 100-year flood level: reached about once in 1,741 years (2.8% over 50 years)
A facility designed only to the 100-year flood has a 40% chance of seeing that flood in 50 years. Raising the floor by an additional freeboard reduces the risk sharply, because flood levels rise only slowly with return period: in the illustrative case, 1 m of freeboard above the 100-year level corresponds to about a 1,700-year event and a 3% chance over 50 years. The actual relationship depends on the river or coast and must come from a hydrological study, but the lesson is general: modest extra elevation buys large reductions in flood risk, which is why many owners set floors 0.6 to 1 m above the 100-year level or at or above the 500-year level.
Flood resilience and climate change
Flooding comes from rivers, coastal storm surge, intense local rainfall overwhelming drainage (pluvial flooding), and groundwater. Historical flood maps can understate future risk: climate change is increasing heavy rainfall intensity and sea levels, and land development upstream increases runoff. Canadian guidance and many owners now apply climate change factors to design rainfall and flood levels (Lesson 7 discussed climate data for design). Flood resilience measures, in order of preference:
- Avoid: choose sites outside floodplains, including the 500-year floodplain and areas of pluvial flooding risk; check flood maps, local history and future projections (DCE-410 covers site selection).
- Elevate: set the finished floor and all critical equipment, including generators, switchgear, transformers, fuel pumps and controls, above the design flood level with generous freeboard.
- Keep water out: grade the site to direct overland flow around buildings (Lesson 1), provide backflow preventers on drains, seal penetrations below flood level, and, where necessary, use flood walls or removable flood barriers.
- Tolerate: where some spaces must be below flood level, use flood-resistant materials and locate only non-critical functions there.
- Plan operations: monitor river and weather forecasts, stock sandbags or barriers, protect fuel deliveries and access roads, and plan for staff access when roads flood.
Access matters as much as the building: a dry data centre on an island of high ground is still in trouble if fuel trucks and staff cannot reach it for days.
Extreme wind and tornadoes
Code wind loads (Lesson 7) cover synoptic winds from large storms and, in coastal regions, hurricanes, at return periods of 50 to 700 years depending on the code and importance. Tornadoes are different: their winds can exceed 300 km/h in a narrow path, with debris impacts and rapid pressure drops, and until recently codes did not address them because any particular building has a very low chance of being hit. Recent code developments have changed this.
Canada records dozens to over a hundred tornadoes a year, mostly in the Prairies, southern Ontario and southern Quebec, and systematic damage surveys by research groups such as the Northern Tornadoes Project have shown that many were previously missed. The 2020 NBC introduced tornado load provisions for buildings of high and post-disaster importance in tornado-prone regions, equivalent to EF2 wind speeds, which owners of critical data centres may choose to apply or exceed.
Designing a whole data centre to resist a direct hit by a violent tornado is very expensive. More common strategies are to harden selected elements, such as concrete walls and roofs for critical rooms, missile-resistant enclosures for generators and fuel systems, and a storm shelter for staff, and to rely on geographic redundancy: a second data centre far enough away that one tornado cannot affect both. Rooftop equipment is especially vulnerable: dry coolers, condensers and their screens must be anchored for wind loads at roof level, and loose roof items become debris that damages other equipment.
Wildfire
Many potential data centre sites in western Canada and the western US are in or near the wildland-urban interface. Wildfire threatens facilities through embers, radiant heat and smoke, and it can cut power and fibre lines, block roads and force evacuation of staff. Measures include defensible space cleared of fuel around buildings, non-combustible exterior materials and roofs, ember-resistant vents and louvres, filters and controls to close outdoor air intakes when smoke is heavy (air-economized cooling must switch to recirculation), ample on-site fuel and water, and plans for staff safety. Smoke also affects equipment: fine particles and corrosive gases can damage electronics if drawn into data halls.
Hostile vehicles
A vehicle driven deliberately at a building can breach walls and deliver attackers or explosives to the most sensitive areas. Hostile vehicle mitigation (HVM) uses a perimeter of crash-rated barriers, such as bollards, walls, planters, beams and active barriers at gates, combined with site layout that prevents vehicles from building up speed toward the facility.
import numpy as np

# Hostile vehicle mitigation: kinetic energy for crash-rated barrier test conditions (ASTM F2656 style)
tests = [("M30", 6800, 48), ("M40", 6800, 64), ("M50", 6800, 80), ("P60 pickup", 2300, 97), ("car C40", 1100, 64)]
for name, m, v_kmh in tests:
    v = v_kmh / 3.6
    KE = 0.5 * m * v ** 2
    print(f"{name:12s}: {m:5d} kg at {v_kmh:3d} km/h -> kinetic energy {KE / 1e6:5.2f} MJ")
# Speed a truck can reach on a straight approach: v = sqrt(2 a d), with a = 2.5 m/s2 for a loaded truck
for d in (15, 30, 60, 100):
    v = np.sqrt(2 * 2.5 * d) * 3.6
print(f"straight run-up of {d:3d} m: a truck can reach about {v:4.0f} km/h")M30 : 6800 kg at 48 km/h -> kinetic energy 0.60 MJ M40 : 6800 kg at 64 km/h -> kinetic energy 1.07 MJ M50 : 6800 kg at 80 km/h -> kinetic energy 1.68 MJ P60 pickup : 2300 kg at 97 km/h -> kinetic energy 0.83 MJ car C40 : 1100 kg at 64 km/h -> kinetic energy 0.17 MJ straight run-up of 15 m: a truck can reach about 31 km/h straight run-up of 30 m: a truck can reach about 44 km/h straight run-up of 60 m: a truck can reach about 62 km/h straight run-up of 100 m: a truck can reach about 80 km/h
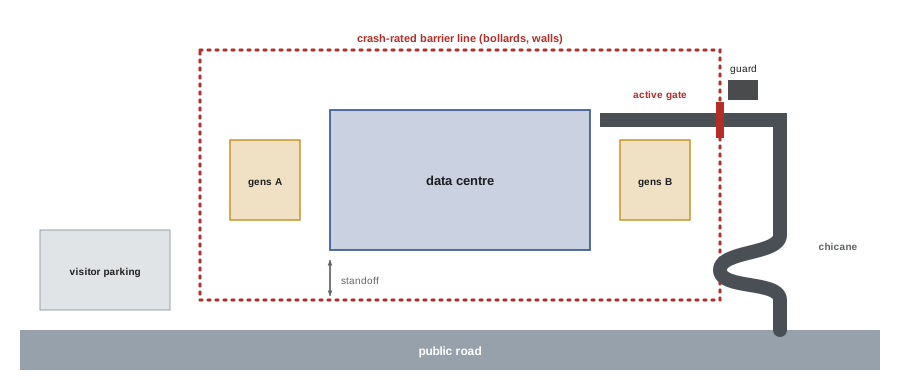
Crash-rated barriers are tested to standards such as ASTM F2656 and PAS 68/IWA 14, which specify the vehicle (car, pickup, medium-duty truck, heavy goods vehicle), impact speed and the maximum penetration of the vehicle past the barrier. An M50 rating means stopping a 6,800 kg truck at 80 km/h, which carries about 1.7 MJ of kinetic energy. Because energy rises with the square of speed, limiting the approach speed is the most effective and economical measure: a straight run-up of 30 m lets a truck reach about 44 km/h, so an M30 barrier may suffice, while a 100 m straight approach allows 80 km/h and requires M50. Designers therefore use curved or chicaned access roads, landscaping berms and offset gates to limit run-up, then select barriers for the achievable speed. Barriers must be continuous around the perimeter, with gaps narrower than a vehicle (typically 1.2 m or less), and their foundations are often the most difficult part to design around buried utilities (Lesson 2).
Blast and standoff
For facilities with high security requirements, designers may consider the effects of explosions, either deliberate attacks or accidents such as a fuel or battery energy storage explosion. Blast pressure falls off rapidly with distance: for a given explosive charge weight \(W\), the effects at distance \(R\) depend on the scaled distance \(Z = R/W^{1/3}\), so doubling the standoff distance reduces the peak pressure several-fold. Standoff distance, keeping vehicles and unscreened deliveries far from the building, is therefore the most effective and cheapest blast protection, which is another reason for a secure perimeter and screened parking away from the building. Where standoff is limited, walls and windows are designed for blast loads (Canadian guidance in CSA S850, Design and assessment of buildings subjected to blast loads; US guidance in UFC 4-010-01 and the Interagency Security Committee standards for federal facilities), with ductile concrete or steel walls, laminated glazing and strong connections that prevent progressive collapse.
Worked problem
Effect of standoff distance on blast load
A blast assessment shows that a given vehicle bomb would produce a peak reflected pressure of about 1,000 kPa on a wall at a standoff of 10 m. Using the rough rule that, in this range, peak pressure falls with roughly the cube of distance, estimate the pressure if the standoff is increased from 10 m to 30 m.
Show solution
- Ratio of distances: 30/10 = 3.
- Pressure falls by about \(3^3 = 27\) times: \(1{,}000/27 \approx 37\) kPa.
Answer: About 40 kPa, low enough that a well-designed concrete wall can resist it with little damage, while 1,000 kPa would breach most walls. This is why security designers push vehicles back from buildings before strengthening the building itself. (The cube relationship is a simplification; actual design uses detailed blast curves.)
Redundancy and site layout as resilience
Structural hardening has limits; resilience also comes from how the facility is arranged:
- Separation: place redundant equipment, such as A and B generator yards, utility feeds, fuel tanks and cooling plants, far enough apart that a single fire, vehicle impact, flood path or falling object cannot disable both.
- Compartmentation: fire-rated separations between data halls, electrical rooms and battery rooms (DCE-440) keep a local event from spreading.
- Protection of critical paths: fuel delivery routes, utility entries and fibre routes kept away from likely hazards and diverse (Lesson 2).
- Geographic redundancy: replicating services in a second facility outside the reach of regional hazards (earthquakes, hurricanes, wildfire, grid failures), which is how large cloud providers achieve high availability despite individual site risks.
- Recovery planning: spare parts, contracts for emergency services, and procedures to restore operation after damage.
Resilience is ultimately a business decision balancing the cost of hardening against the consequences of an outage, which differ enormously between a single enterprise data centre and one node in a widely replicated cloud network.
Common mistakes
MistakeTreating code compliance as operational resilience.
InsteadSet explicit performance objectives and protect nonstructural systems.
MistakeDesigning only to the 100-year flood with minimal freeboard.
InsteadAdd generous freeboard, consider the 500-year level and climate change.
MistakeForgetting site access and fuel supply in flood planning.
InsteadProtect roads and fuel deliveries, and plan for isolation.
MistakeSelecting crash barriers without controlling vehicle approach speed.
InsteadLimit run-up with layout, then rate barriers for achievable speeds.
MistakeLocating redundant systems side by side.
InsteadSeparate A and B systems so one event cannot disable both.
Summary and key terms
- Resilience design sets hazard levels and performance objectives beyond code life safety, including nonstructural systems.
- The chance of a T-year event in n years is \(1 - (1 - 1/T)^n\); a 100-year flood has a 40% chance in 50 years.
- Flood resilience prefers avoidance and elevation with generous freeboard, accounting for climate change and access.
- Tornado provisions are entering codes; hardening critical elements and geographic redundancy are common strategies.
- Wildfire requires defensible space, ember-resistant envelopes, smoke management and operational planning.
- Hostile vehicle mitigation combines crash-rated barriers with layouts that limit approach speed.
- Standoff distance is the most effective blast protection; redundancy and separation provide resilience beyond hardening.
- Resilience
- The ability to withstand, adapt to and recover from disruptive events.
- Operational performance
- The condition in which a facility keeps functioning after an event.
- Return period
- The average interval between events of a given magnitude.
- Freeboard
- The height of a floor or structure above the design flood level.
- Pluvial flooding
- Flooding from intense local rainfall overwhelming drainage.
- Tornado-prone region
- An area where codes require consideration of tornado loads.
- Hostile vehicle mitigation
- Measures to stop vehicles used as weapons.
- Crash rating
- A barrier's tested capacity to stop a specified vehicle at a given speed.
- Standoff distance
- The distance between a potential explosion and a building.
- Geographic redundancy
- Replication of services in facilities far enough apart to avoid shared hazards.
Practice problems
Work each problem on paper first, then reveal the answer to check.
Chance of a 200-year flood at least once in 30 years?
Show answer
\(1 - 0.995^{30} = 14\%\).
What does operational performance require beyond structure?
Show answer
Anchored equipment, working services, fuel, communications and staff.
Name three flood resilience measures in order of preference.
Show answer
Avoid the floodplain, elevate, keep water out.
Why is site access part of flood resilience?
Show answer
Fuel and staff must reach the facility during and after the flood.
Kinetic energy of 6,800 kg at 64 km/h?
Show answer
About 1.07 MJ.
Speed reachable by a truck accelerating at 2.5 m/s² over 40 m?
Show answer
\(\sqrt{200} = 14.1\) m/s ≈ 51 km/h.
What is the most effective blast protection?
Show answer
Standoff distance.
What is scaled distance?
Show answer
\(Z = R/W^{1/3}\), distance divided by the cube root of charge weight.
How does wildfire smoke affect cooling design?
Show answer
Outdoor air intakes must close or filter; economizers switch to recirculation.
What is geographic redundancy?
Show answer
Replicating services in distant facilities so one regional event cannot stop both.
Lesson quiz · 5 questions
Score 60% or more to complete this lesson.
Create a free account to save your progress, take quizzes and earn a certificate.