
DCE-420 · Lesson 3 of 12 · 32 min
Interconnection studies and queues
For most data centre projects since 2023, the question has not been what power costs but when it can be connected. Utilities that once connected a 20 MW facility within a year or two now face requests for hundreds or thousands of megawatts at single sites, totalling many times their existing peak demand. Each request must be studied to determine what transmission and generation additions are needed, who pays for them and how long they will take. This lesson explains how large loads and generators are connected to the grid, how interconnection studies work, why queues have grown so long, and what developers can do to secure power on a predictable schedule.
Load versus generator interconnection
Connecting a large load and connecting a generator are different processes with different rules:
- Generator connections are governed by each province's system operator and transmitter: in Ontario, the IESO's connection assessment and approval process and Hydro One's customer impact assessment; in Alberta, the AESO's connection process; in vertically integrated provinces, the Crown utility's procedures, often tied to competitive procurements.
- Load connections are governed by provincial transmission and distribution codes and utility tariffs, and in several provinces by new government approval requirements specific to data centres.
For a data centre, both matter: the load connection determines when the campus can draw power, and generator interconnection determines how quickly the new supply needed to serve it (and any co-located or contracted generation) can come online.
The study process
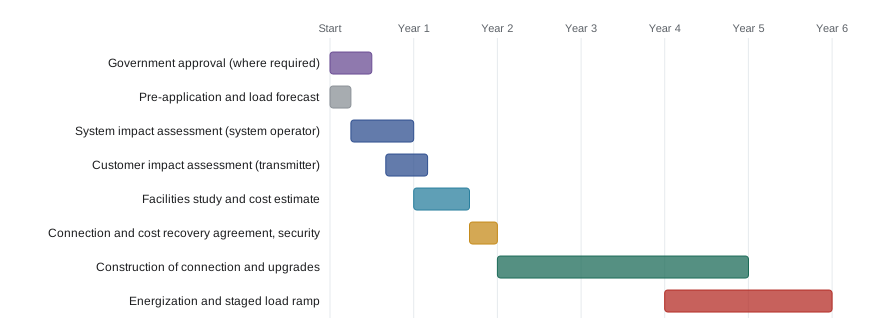
Whether for a load or a generator, interconnection studies follow a similar sequence of increasingly detailed analyses:
- Pre-application or scoping: the customer describes the project, location, size and ramp schedule; the utility gives preliminary information about nearby facilities and capacity.
- Feasibility or preliminary study: steady-state power flow analysis (ELE-380) identifies thermal overloads and voltage violations under normal and N-1 contingency conditions.
- System impact study: detailed power flow, short-circuit, stability and sometimes electromagnetic transient studies under many scenarios and contingencies, identifying the required network upgrades.
- Facilities study: engineering design and cost estimates for the connection facilities (substation, lines, protection, metering) and network upgrades.
- Agreement: an interconnection or connection agreement specifying the facilities, costs, security, schedule, operating requirements and, for loads, the contracted demand and ramp.
Each stage takes months; the whole process for a large load or generator commonly takes two to four years before construction of upgrades even begins. Upgrades themselves may take years more: a new 500 kV line can take a decade from conception to energization, while large power transformers have had lead times of two to four years.
What studies look for
A large load affects the grid in several ways that studies must evaluate:
- Thermal capacity: whether lines and transformers can carry the additional flow under normal conditions and after contingencies. A 500 MW load at a single point can overload multiple circuits.
- Voltage: large loads depress voltage, especially after contingencies; reactive power support (capacitor banks, STATCOMs) may be needed.
- Resource adequacy: whether there is enough generation to serve the load at peak, which in many regions is now the binding constraint rather than transmission.
- Stability and ride-through: data centre loads are dominated by power electronics (UPS rectifiers and server power supplies). When a fault depresses voltage, many UPS systems transfer to battery within milliseconds, removing their load from the grid. In July 2024, a 230 kV fault in Virginia caused about 1,500 MW of data centre load to transfer to backup simultaneously, creating a sudden surplus that operators had to manage. NERC has since identified large-load ride-through behaviour as a reliability risk, and system operators increasingly require data centres to remain connected through specified voltage and frequency disturbances.
- Power quality: harmonics and, for AI training clusters, rapid load swings of tens of megawatts as computation synchronizes across thousands of GPUs.
Worked problem
Thermal capacity check
A substation is supplied by two 230 kV lines, each rated 400 MVA. Existing load at the substation peaks at 280 MVA. Under N-1 (one line out), how much new load can be added without overloading the remaining line, allowing a 5% margin?
Show solution
- With one line out, the remaining line carries all the load: limit \(0.95 \times 400 = 380\) MVA.
- Available capacity: \(380 - 280 = 100\) MVA.
- At 0.95 power factor (ELEC-210): \(100 \times 0.95 = 95\) MW.
Answer: About 95 MW, even though the two lines together are rated 800 MVA. A 300 MW data centre would need a third line, larger conductors, or a new connection elsewhere. This N-1 limit, rather than total capacity, usually decides how much load a location can accept (ELE-380 Lesson 7).
Why queues grew
In the 2020s, interconnection requests grew far faster than utilities could study or build. In Alberta, the AESO received requests for more than 15 GW of data centre load in 2024 and 2025, compared with a provincial peak of about 12.5 GW, and responded by allocating a limited interim block of capacity and then, under the 2026 Data Centre Regulation, setting rules that favour projects bringing their own generation. In Ontario, the IESO forecast demand growth of 75% by 2050, with data centres a major contributor, and the province gave the minister authority to approve or refuse data centre connections. Hydro-Québec has required government authorization for new loads of 5 MW or more since 2023, and BC Hydro allocates a fixed block of power to AI and data centre projects competitively.
Many requests are speculative: developers file at multiple sites, hoping to secure capacity at one, and utilities have no way to tell which are real. This inflates queues, slows studies for everyone and makes load forecasts unreliable, which in turn affects resource planning and rates.
Worked problem
Queue attrition and real demand
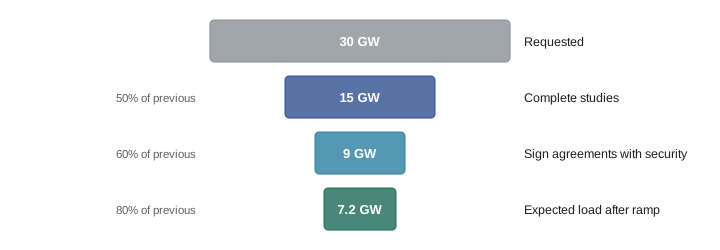
A utility has 30 GW of data centre requests. Experience suggests that 70% of requests will withdraw before signing an agreement and that signed projects ramp to an average of 80% of their contracted demand. Estimate the real load to plan for.
Show solution
- Remaining after withdrawals: \(30 \times 0.30 = 9\) GW.
- Expected load: \(9 \times 0.80 = 7.2\) GW.
Answer: About 7 GW, less than a quarter of the requested 30 GW. Overestimating demand leads to stranded investments paid for by other customers; underestimating leads to shortages. This uncertainty is why utilities and regulators are adding financial commitments and readiness requirements that force speculative requests out early.
Provincial responses
Each province has responded to the surge in requests differently:
- Ontario: under the Transmission System Code, a customer pays a capital contribution for connection facilities and for network upgrades not covered by the expected revenue from its load over a defined period. The IESO introduced requirements for large computational loads, and since 2025 the Minister of Energy can approve or refuse connection of data centres above a threshold, with the province prioritizing projects that serve Ontario's economic interests and data sovereignty.
- Alberta: the AESO allocated interim capacity among large-load applicants in 2025 and the 2026 Data Centre Regulation distinguishes projects that bring their own generation from "bridged" projects that use limited grid capacity until generation arrives, with required contributions to transmission and cost recovery.
- Québec: new loads of 5 MW or more need government authorization, and power is allocated to projects judged most beneficial to the province, with a separate data centre rate proposed.
- British Columbia: a competitive call allocates 400 MW over two years, with a per-project cap, after a pause on new connections for some energy-intensive uses.
Generator connections also matter: Ontario's long-term procurements (LT1, LT2) and Alberta's market-driven additions determine how quickly new supply can be built to serve growing demand.
Indigenous partnerships in new supply
New transmission and generation built to serve large loads in Canada increasingly involve Indigenous equity ownership, which shares benefits, supports consultation and can speed approvals. Data centre developers also partner with First Nations on sites and generation (DCE-410).
- Ontario: Hydro One offers First Nations partners up to 50% equity in new large transmission lines, and the Indigenous Opportunities Financing Program supports equity in energy projects.
- Alberta: the Alberta Indigenous Opportunities Corporation provides loan guarantees for Indigenous ownership in energy, transmission and related projects.
- Federal: the Canada Indigenous Loan Guarantee Program, launched in 2024 and expanded in 2025, backs Indigenous equity in major resource and energy projects.
Cost responsibility
Who pays for the facilities needed to connect a large load is one of the most contested questions in the industry:
- Direct connection facilities (the customer's substation, the tap line) are normally paid by the customer.
- Network upgrades (reinforcing shared lines and substations) may be paid by the customer, by all customers through rates, or split; rules vary widely.
- Generation needed to serve the load is paid by all customers through rates or capacity markets, unless the customer brings its own supply.
Ontario uses an economic evaluation: the transmitter estimates the incremental revenue the customer's load will pay over the evaluation period and compares it with the cost of facilities; if revenue falls short, the customer pays a capital contribution.
Worked problem
Economic evaluation of a connection
Connecting a 100 MW data centre requires $90 million of transmission facilities. The transmitter expects net transmission revenue of $9 million a year from the load over a 25-year evaluation period, discounted at 6%. What capital contribution is required?
Show solution
- Present value of revenue: annuity factor \((1 - 1.06^{-25})/0.06 = 12.78\).
- PV \(= 9 \times 12.78 = \$115\) million.
- Since $115 million exceeds $90 million, no contribution is needed on this basis, provided the load materializes.
- If the load ramps to only 40 MW (revenue $3.6 million a year): PV \(= 46\) million; shortfall \(90 - 46 = \$44\) million.
Answer: No up-front contribution if the full load appears, but about $44 million of exposure for other customers if it does not. This is why utilities require security (letters of credit, guarantees) or minimum demand commitments tied to the forecast ramp, and why true-up provisions recalculate contributions if load falls short.
Strategies for securing power
Data centre developers use several approaches to obtain power faster and more reliably:
- Early engagement: file requests years ahead, share accurate load forecasts and ramp schedules, and build relationships with utility planners.
- Site selection for available capacity: target locations with existing transmission headroom, retired generation sites with existing connections, or areas with surplus generation (DCE-410).
- Phased ramps: request capacity in stages that match the utility's ability to build, with firm early phases and options for later ones.
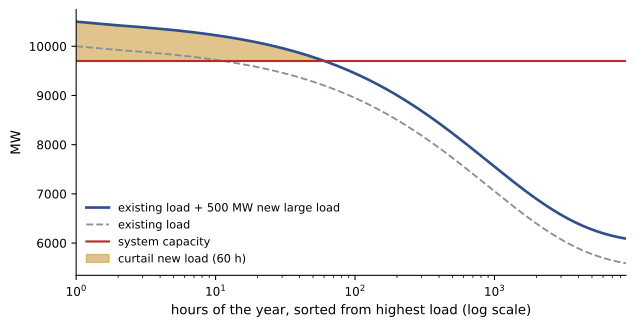
- Flexibility: agree to curtail load during system emergencies or peak periods in exchange for faster connection. Studies suggest that if large loads could curtail for a fraction of a percent of hours, existing grids could connect tens of gigawatts more load without new capacity.
- Bring your own generation: on-site or co-located generation (Lessons 7 and 10) can serve the load initially ("bridging") or permanently, reducing the burden on the grid.
- Fund upgrades: offer to pay for network upgrades or provide security, making the request more credible and protecting other customers.
- Buy existing positions: acquire sites or projects with existing connection agreements or queue positions.
Worked problem
Value of a flexible connection
A utility can connect 300 MW of firm load to a site in 2027, or 500 MW if the customer agrees to reduce to 300 MW for up to 60 hours a year. The extra 200 MW would otherwise wait until 2030. If each MW of capacity earns $1.5 million a year in gross margin for the operator, what is the value of three extra years for 200 MW, and what is the cost of 60 hours of curtailment of 200 MW?
Show solution
- Extra margin: \(200 \times 1.5 \times 3 = \$900\) million over three years.
- Curtailed energy: \(200 \times 60 = 12{,}000\) MWh a year, or 0.68% of the 200 MW block's annual energy.
- Lost margin at the same rate: \(0.0068 \times 200 \times 1.5 = \$2.1\) million a year (or less if workloads shift elsewhere or on-site generation covers the gap).
Answer: The flexible connection is worth roughly $900 million against about $2 million a year of curtailment cost. Even if curtailment requires on-site generation, the trade is strongly favourable, which is why flexible connections are becoming common.
Lesson 4 examines how flexibility can unlock capacity sooner, and Lesson 9 the contract terms, such as minimum bills and collateral, that come with large-load connections.
Common mistakes
MistakeAssuming that total line ratings determine how much load can connect.
InsteadN-1 contingency limits, voltage and resource adequacy usually bind first.
MistakeFiling at many sites without committing to any.
InsteadNew rules impose deposits, penalties, disclosure and security that make speculation costly.
MistakeIgnoring ride-through requirements.
InsteadUPS and power electronics must stay connected through specified disturbances, not drop off together.
MistakeAssuming that a signed agreement guarantees energization on schedule.
InsteadUpgrades, transformers and generation can be delayed; plan for phased ramps and bridging.
MistakeTreating curtailment agreements as cost-free.
InsteadPrice the lost output or on-site generation and include it in the business case.
Summary and key terms
- Connection timing is now the binding constraint for many data centre projects.
- Load and generator connections follow provincial codes, system operator processes and new data centre approval rules.
- Studies progress from feasibility to system impact to facilities studies and agreements, taking years.
- Studies check thermal capacity, voltage, resource adequacy, stability, ride-through and power quality.
- Queues are inflated by speculative requests, so real load is much less than requested.
- Provinces now allocate limited capacity, require approvals, and favour projects bringing their own generation.
- Cost responsibility depends on economic evaluations, contributions, security and minimum demand commitments.
- Early engagement, phasing, flexibility and bringing generation speed connection.
- System impact assessment
- A study of a connection's effect on the transmission system and required upgrades.
- Customer impact assessment
- A transmitter's study of a connection's effect on other customers.
- Capital contribution
- A customer payment toward connection facilities not covered by expected revenue.
- Economic evaluation
- Comparison of the present value of a customer's revenue with connection costs.
- Network upgrade
- Reinforcement of shared transmission facilities for a new connection.
- N-1 contingency
- Loss of any single element, which the system must withstand.
- Ride-through
- The ability of equipment to stay connected through voltage or frequency disturbances.
- Bridged project
- A data centre using limited grid capacity until its own generation is available.
- Flexible connection
- A connection allowing more load in exchange for curtailment when needed.
- Load ramp
- The schedule by which a facility's demand grows to its contracted level.
Practice problems
Work each problem on paper first, then reveal the answer to check.
List the main stages of an interconnection study.
Show answer
Pre-application, feasibility, system impact, facilities study, agreement.
Two 300 MVA lines supply a substation with 180 MVA of load. Under N-1 with no margin, how much more load (MVA) can connect?
Show answer
300 − 180 = 120 MVA.
Why can UPS systems create a grid stability problem?
Show answer
During faults many may transfer to battery simultaneously, suddenly removing large amounts of load.
A utility receives 12 GW of requests; 75% withdraw and the rest reach 85% of contract. Expected load?
Show answer
12 × 0.25 × 0.85 = 2.55 GW.
What does Ontario's economic evaluation compare?
Show answer
The present value of expected revenue from the customer with the cost of connection facilities; any shortfall is a capital contribution.
What is the 25-year, 6% annuity factor, and the PV of $5 million a year?
Show answer
12.78; $63.9 million.
What does Alberta's Data Centre Regulation favour?
Show answer
Projects that bring their own generation, with limited grid capacity for bridged projects.
Give three strategies to secure power faster.
Show answer
Any three: early engagement, choosing sites with headroom, phased ramps, flexibility, bringing generation, funding upgrades, buying existing positions.
A load curtails 150 MW for 40 hours a year. Curtailed energy?
Show answer
6000 MWh.
Why do utilities require financial security from large loads?
Show answer
To protect other customers from paying for facilities if the load never materializes.
Lesson quiz · 5 questions
Score 60% or more to complete this lesson.
Create a free account to save your progress, take quizzes and earn a certificate.