
DCE-420 · Lesson 2 of 12 · 27 min
Electricity markets and prices
Lesson 1 described how the electricity sector is organized and how large customers are billed. Behind every bill in a competitive region, and behind many regulated rates too, sit wholesale markets that set prices hour by hour for energy, year by year for capacity, and minute by minute for the reserves that keep the grid stable. A data centre owner who understands how those prices are formed can forecast costs, choose between fixed and index contracts, judge the value of flexibility, and anticipate how its own large load may move prices. This lesson explains energy market clearing and the merit order, scarcity pricing, locational prices, capacity markets, ancillary services, forward prices and hedging, and the effect of large new loads on markets.
How an energy market clears
In a wholesale energy market, generators submit offers stating how much they can produce and the minimum price they will accept, and the system operator dispatches the cheapest offers first until supply meets demand. Sorting offers from cheapest to most expensive gives the supply stack or merit order: renewables and nuclear (near-zero marginal cost) at the bottom, then hydro (priced at its opportunity cost), combined-cycle gas, older gas and oil units, and peaking turbines at the top. All dispatched generators are paid the price of the last (marginal) offer needed, the uniform clearing price. This rewards low-cost generators with a margin that pays for their capital costs, and gives every generator an incentive to offer at its true marginal cost.
Most markets run a day-ahead market, which schedules generation for each hour of the next day and settles financially, and a real-time market, which balances actual supply and demand every five minutes and settles deviations from the day-ahead schedule. A customer buying at index pays the real-time or day-ahead price for its consumption.
import numpy as np

# A simple supply stack: (name, capacity MW, offer price $/MWh)
stack = [("wind and solar", 0, 0.0), ("nuclear", 3000, 5.0), ("hydro", 2000, 15.0), ("combined cycle gas", 5000, 45.0),
         ("older gas steam", 2000, 75.0), ("peaking turbines", 1500, 140.0), ("emergency (price cap)", 10000, 1000.0)]
def clear(demand, renewables):
    offers = [(p, (renewables if n.startswith("wind") else c), n) for n, c, p in stack]
    offers.sort()
    supplied = 0.0
    for price, cap, name in offers:
        supplied += cap
        if supplied >= demand:
            return price, name
    return None, None

hours = [(4, 9000, 1500), (10, 11500, 5000), (14, 12500, 8000), (18, 14000, 1500), (19, 13600, 300)]
for h, dem, ren in hours:
    price, marginal = clear(dem, ren)
    print(f"hour {h:2d}: demand {dem:6,} MW, wind and solar {ren:5,} MW -> price ${price:7.2f}/MWh set by {marginal}")
# A new 300 MW data centre at the evening peak
price, marginal = clear(13900, 300)
print(f"evening peak plus a 300 MW data centre: price ${price:.2f}/MWh set by {marginal}")hour 4: demand 9,000 MW, wind and solar 1,500 MW -> price $ 45.00/MWh set by combined cycle gas hour 10: demand 11,500 MW, wind and solar 5,000 MW -> price $ 45.00/MWh set by combined cycle gas hour 14: demand 12,500 MW, wind and solar 8,000 MW -> price $ 15.00/MWh set by hydro hour 18: demand 14,000 MW, wind and solar 1,500 MW -> price $ 140.00/MWh set by peaking turbines hour 19: demand 13,600 MW, wind and solar 300 MW -> price $ 140.00/MWh set by peaking turbines evening peak plus a 300 MW data centre: price $1000.00/MWh set by emergency (price cap)
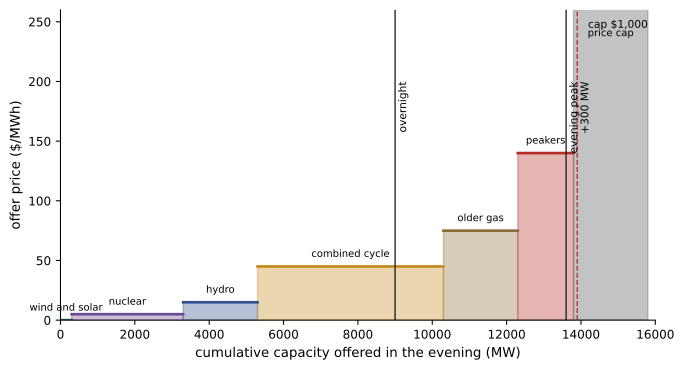
Prices are low when renewables cover much of demand at midday, moderate when gas sets the price overnight, and high in the evening when solar fades and peakers are needed. Near the top of the stack, small changes in demand cause huge price changes: adding 300 MW at the peak pushes the price from $140 to the cap of $1,000/MWh. This steepness is why a large load's willingness to reduce consumption during a few peak hours has such value, and why the timing of consumption matters more than its total.
Scarcity pricing and price caps
Energy-only markets rely on occasional very high prices to pay for capacity that runs only a few hours a year. Market designs include administratively set prices that rise as reserves shrink and caps on how high prices can go:
- Alberta runs an energy-only market with a price cap of $999.99/MWh and a floor of $0, and pool prices regularly hit the cap during tight conditions. The province is redesigning its market (the Restructured Energy Market) to address reliability and price volatility.
- Ontario's IESO launched its renewed market in May 2025, introducing a day-ahead market and locational prices for generators; most consumers pay a uniform price plus the Global Adjustment, which recovers the cost of contracted and regulated generation and for large customers is allocated by their share of system peaks (Lesson 1).
For a customer on index pricing, a few scarcity hours can dominate a year's costs. One hour at $1,000/MWh for a 100 MW load costs $100,000, as much as 25 hours at a typical $40/MWh.
Locational prices
Where transmission constraints bind, markets calculate locational marginal prices (LMPs) at each node or zone, reflecting the cost of serving one more megawatt there, including congestion and losses (ELE-380, Lesson 7). A data centre in a load pocket behind constrained transmission can pay persistently higher prices than one in an area with surplus generation, and the spread between the price at a renewable project's node and the customer's node creates basis risk in power purchase agreements (Lesson 5). Historical LMP data, available from system operators, are an important input to site selection and procurement decisions.
Capacity markets
In regions with capacity markets, load-serving entities must procure enough capacity, generation, storage or demand response committed to be available at system peaks, to meet forecast peak demand plus a reserve margin, typically several years ahead. Capacity auctions set a price per MW of capacity per day (or per year), which is passed through to customers in proportion to their contribution to the system peak.
Worked problem
Capacity cost per MWh
A capacity auction clears at $270/MW-day. A 100 MW data centre with a nearly constant load is charged for 100 MW of peak load contribution plus a 15% reserve margin. What is its annual capacity cost, and what does that add per MWh consumed?
Show solution
- Capacity obligation: \(100 \times 1.15 = 115\) MW. Annual cost: \(115 \times 270 \times 365 = \$11.3\) million.
- Energy consumed: \(100 \times 8{,}760 = 876{,}000\) MWh. Added cost: \(11.3/0.876 = \$12.9\)/MWh.
Answer: About $11.3 million a year, adding roughly $13/MWh to the cost of energy. Capacity prices in PJM rose sharply in the auctions for 2025/26 and 2026/27 (to around $270 and then the cap of about $330/MW-day), driven in part by data centre load growth, making capacity a significant and volatile component of cost. Demand response that reduces the customer's load at the system peak reduces its capacity obligation directly.
Canadian provinces do not generally run centralized capacity markets like PJM's; Ontario procures capacity through IESO capacity auctions (for demand response and other resources) and long-term competitive procurements for new generation and storage, while vertically integrated provinces plan capacity through utility resource plans. Alberta's market redesign is considering how to ensure adequacy without a capacity market.
Ancillary services
System operators also buy ancillary services that keep the grid stable: regulation (resources that follow AGC signals second by second), spinning and non-spinning reserves (capacity available within minutes after a contingency), fast frequency response, and in some markets ramping products. Prices for these services are usually modest compared with energy, but they offer revenue to flexible resources, including batteries and, increasingly, flexible loads. A data centre with on-site batteries or the ability to reduce load quickly can participate in some reserve markets, subject to metering, telemetry and performance requirements (Lesson 4).
Forward prices and hedging
Electricity for future delivery trades in forward and futures markets for standard products, such as monthly or annual blocks of around-the-clock or peak energy at major hubs. The forward curve shows the market's current prices for each future period and is the basis for fixed-price contracts offered by retailers and for valuing PPAs. Forward prices for electricity track natural gas forward prices closely in gas-dominated markets, because gas units set the price in most hours.
Lesson 1 described the main hedging products. The question for a data centre is how much price risk to accept. The answer depends on the company's tolerance for budget variance, its ability to pass costs to customers, and the premium it must pay for certainty.
import numpy as np

rng = np.random.default_rng(2)
load = 100.0                                          # MW, flat
hours = 8760
years = 2000
# Annual average pool price varies year to year (lognormal around $70/MWh), with occasional scarcity years
avg = 70 * np.exp(rng.normal(0, 0.3, years))
scarcity = rng.random(years) < 0.1
avg = avg + np.where(scarcity, rng.uniform(30, 120, years), 0)
index_cost = load * hours * avg / 1e6                 # $ million per year buying at the pool
block_price = 84.0                                    # fixed price offered for a flat 80 MW block
block_cost = (80 * hours * block_price + 20 * hours * avg) / 1e6
for name, c in (("all at pool (index)", index_cost), ("80 MW fixed block + 20 MW index", block_cost)):
    print(f"{name:32s}: mean ${c.mean():5.1f}M, 5th-95th percentile ${np.percentile(c, 5):5.1f}M to ${np.percentile(c, 95):5.1f}M, worst year ${c.max():5.1f}M")
print(f"expected premium paid for the hedge: ${block_cost.mean() - index_cost.mean():.1f}M per year")all at pool (index) : mean $ 69.0M, 5th-95th percentile $ 37.0M to $126.4M, worst year $194.7M 80 MW fixed block + 20 MW index : mean $ 72.7M, 5th-95th percentile $ 66.3M to $ 84.1M, worst year $ 97.8M expected premium paid for the hedge: $3.6M per year
The hedge narrows the range of annual costs from about $37 to $126 million to about $66 to $84 million, and cuts the worst year roughly in half, for an expected premium of a few million dollars a year. Whether that is worth paying depends on what a $100 million surprise would do to the business. Hedging 80% rather than 100% of the load leaves room for load to ramp more slowly than planned without being over-hedged (Lesson 1).
Large loads and market prices
Data centres are now large enough to move markets. Adding hundreds of megawatts of constant load shifts demand up the supply stack in every hour, raising energy prices, and raises forecast peak demand, raising capacity requirements and prices. Analyses of recent PJM capacity auctions attributed a large part of the price increase to forecast data centre growth. This has made large-load cost allocation a central regulatory issue (Lesson 9): whether new large customers should pay for the generation and transmission built for them, through special tariffs, minimum bills or self-supply requirements, so that other customers are not burdened.
Worked problem
Effect of a large load on energy prices
In a market where the supply stack near typical demand rises by about $2/MWh for each additional 1,000 MW, a cluster of data centres adds 3,000 MW of constant load. Estimate the change in the average energy price and the extra cost to the market's other 80,000 MW of average load.
Show solution
- Price increase: \(3 \times 2 = \$6\)/MWh.
- Extra annual cost to other load: \(80{,}000 \times 8{,}760 \times 6 = \$4.2\) billion.
Answer: About $6/MWh, or roughly $4 billion a year across other customers, before any new generation is built in response. The estimate is crude (new supply would enter over time), but it shows why regulators scrutinize how large loads are served and why flexible operation, which avoids adding load at peak, is valued.
Common mistakes
MistakeForecasting energy costs from average prices alone.
InsteadAccount for scarcity hours, which can dominate annual costs on index pricing.
MistakeIgnoring capacity charges in regions with capacity markets.
InsteadInclude capacity costs, which can add $10/MWh or more and are volatile.
MistakeAssuming prices are the same everywhere in a market.
InsteadCheck locational prices and congestion at the site.
MistakeHedging 100% of forecast load before it materializes.
InsteadHedge in step with confirmed load ramps to avoid being over-hedged.
MistakeOverlooking the effect of a large load on market prices and regulation.
InsteadExpect scrutiny of cost allocation and value flexibility at peak.
Summary and key terms
- Energy markets dispatch offers in merit order and pay the marginal clearing price, in day-ahead and real-time markets.
- Prices rise steeply near the top of the stack; scarcity pricing and caps shape extreme prices.
- Locational prices reflect congestion and losses and create basis risk.
- Capacity markets charge for contribution to system peaks; recent prices have risen sharply with load growth.
- Ancillary services pay flexible resources; forward curves underpin fixed-price contracts and hedges.
- Large data centre loads raise prices and make cost allocation a regulatory priority.
- Merit order
- Generation offers sorted from lowest to highest price.
- Clearing price
- The price of the marginal offer needed to meet demand, paid to all dispatched supply.
- Day-ahead market
- A market scheduling generation for each hour of the next day.
- Real-time market
- A market balancing supply and demand at short intervals and settling deviations.
- Price cap
- The maximum price allowed in a market.
- Operating reserve demand curve
- A mechanism adding scarcity value to prices as reserves fall.
- Capacity market
- A market procuring commitments of resources available at peak.
- Ancillary services
- Regulation, reserves and other services that maintain grid stability.
- Forward curve
- Current market prices for delivery in future periods.
- Basis risk
- Risk from price differences between two locations.
Practice problems
Work each problem on paper first, then reveal the answer to check.
Offers: 2,000 MW at $10, 3,000 MW at $40, 1,000 MW at $90. Clearing price at 4,500 MW demand?
Show answer
$40/MWh.
And at 5,500 MW?
Show answer
$90/MWh.
Cost of 10 hours at $1,000/MWh for a 50 MW load?
Show answer
$500,000.
Capacity at $150/MW-day for 60 MW: annual cost?
Show answer
$3.29 million.
Added cost per MWh for that 60 MW flat load?
Show answer
\(3.29\text{M}/525{,}600 = \$6.3\)/MWh.
What sets electricity forward prices in gas-dominated markets?
Show answer
Mainly natural gas forward prices.
Why hedge 80% rather than 100% of forecast load?
Show answer
To avoid being over-hedged if load ramps slowly.
What is basis risk in a PPA?
Show answer
The price difference between the project node and the customer's node or hub.
Name two ancillary services.
Show answer
Regulation, spinning reserve, non-spinning reserve, fast frequency response.
Why does flexibility at peak have high value?
Show answer
Prices and capacity obligations are set by the top of the supply stack.
Lesson quiz · 5 questions
Score 60% or more to complete this lesson.
Create a free account to save your progress, take quizzes and earn a certificate.