
DCE-420 · Lesson 11 of 12 · 29 min
Comparing the economics of power options
Data centre owners must compare power options that differ in almost every respect: a utility tariff with monthly bills, an on-site gas plant with large capital costs and fuel risk, a virtual PPA that is a financial hedge rather than physical supply, a nuclear contract starting years from now, and batteries that earn value in several ways at once. Comparing them fairly requires converting costs to common terms, accounting for time and risk, and valuing what really matters to the business, which is often speed to power rather than cost per megawatt-hour. This lesson develops the levelized cost of energy and its limits, total delivered cost, the economics of redundancy and bridging power, net present value analysis with uncertainty, and the valuation of time to power.
Levelized cost of energy
The levelized cost of energy (LCOE) is the constant price per MWh that would recover a resource's lifetime costs, including a return on capital. For a plant with capital cost \(C\) per kW, fixed operating costs \(F\) per kW-year, variable costs (fuel and variable maintenance) \(V\) per MWh, and capacity factor CF:
where the capital recovery factor (CRF) converts the capital cost into an equal annual payment over \(n\) years at discount rate \(r\), and \(8.76 \cdot \mathrm{CF}\) is the MWh produced per kW per year.
import numpy as np

def crf(r, n):                                          # capital recovery factor
    return r * (1 + r) ** n / ((1 + r) ** n - 1)

def lcoe(capex_kw, fixed_kw_yr, var_mwh, heat_rate, gas, cf, life, r=0.08):
    annual_mwh_per_kw = 8.76 * cf                       # MWh per kW-year
    capital = capex_kw * crf(r, life) / annual_mwh_per_kw
    fixed = fixed_kw_yr / annual_mwh_per_kw
    fuel = heat_rate * gas
    return capital, fixed, var_mwh + fuel

options = {
    "combined cycle (on site)": dict(capex_kw=2200, fixed_kw_yr=30, var_mwh=3.0, heat_rate=6.6, gas=3.5, cf=0.90, life=25),
    "reciprocating engines": dict(capex_kw=1800, fixed_kw_yr=25, var_mwh=8.0, heat_rate=8.3, gas=3.5, cf=0.90, life=20),
    "simple-cycle aeroderivatives": dict(capex_kw=1600, fixed_kw_yr=20, var_mwh=6.0, heat_rate=9.3, gas=3.5, cf=0.90, life=20),
    "solid oxide fuel cells": dict(capex_kw=3500, fixed_kw_yr=60, var_mwh=10.0, heat_rate=6.5, gas=3.5, cf=0.90, life=15),
}
for name, p in options.items():
    c, f, v = lcoe(**p)
    print(f"{name:30s}: capital ${c:5.1f} + fixed ${f:4.1f} + fuel and variable ${v:5.1f} = ${c + f + v:6.1f}/MWh")
print("for comparison: a large-load utility tariff of about $75/MWh all-in, or a nuclear PPA in the $80 to $100/MWh range")
# Bridging: on-site engines run only until the grid arrives in year 3, then sit as backup
c, f, v = lcoe(**options["reciprocating engines"])
print(f"engines used only 3 of 20 years: capital and fixed costs over 3 years add about ${(c + f) * 20 / 3:.0f}/MWh unless resold or kept as backup")combined cycle (on site) : capital $ 26.1 + fixed $ 3.8 + fuel and variable $ 26.1 = $ 56.0/MWh reciprocating engines : capital $ 23.3 + fixed $ 3.2 + fuel and variable $ 37.1 = $ 63.5/MWh simple-cycle aeroderivatives : capital $ 20.7 + fixed $ 2.5 + fuel and variable $ 38.6 = $ 61.8/MWh solid oxide fuel cells : capital $ 51.9 + fixed $ 7.6 + fuel and variable $ 32.8 = $ 92.2/MWh for comparison: a large-load utility tariff of about $75/MWh all-in, or a nuclear PPA in the $80 to $100/MWh range engines used only 3 of 20 years: capital and fixed costs over 3 years add about $176/MWh unless resold or kept as backup
At high capacity factors, combined-cycle and engine plants produce power in the range of $55 to $65/MWh under these assumptions, broadly competitive with large-load utility tariffs, while fuel cells cost more but may be faster to deploy and easier to permit. These figures are indicative only: capital costs for gas turbines and engines rose sharply in 2024 and 2025 as demand from data centres outstripped manufacturing capacity, and delivery times for large turbines stretched to several years.
LCOE has important limits for data centre decisions:
- It ignores redundancy: a data centre needing 100 MW of reliable supply from on-site generation must install perhaps 120 to 140 MW (N+1 or N+2, DCE-340), raising the capital cost per MWh delivered.
- It ignores timing: LCOE treats a plant producing in two years and a contract starting in seven years identically.
- It ignores risk: fuel price, carbon policy, technology and regulatory risks differ greatly between options.
- It ignores value: power when needed, hourly carbon-free energy, capacity accreditation and flexibility are worth different amounts.
- A short use period destroys the economics: a plant used for only a few years before the grid arrives must recover its capital over those years or be repurposed.
Worked problem
Redundancy and LCOE
A data centre needs 100 MW of reliable on-site power. Engines are installed as 14 units of 10 MW (N+4, so that 10 can carry the load with margin for maintenance and failures). If the LCOE of engines running at 90% capacity factor is $63.5/MWh, with $26.5/MWh of capital and fixed costs, what is the effective cost per MWh of load served?
Show solution
- Installed capacity: 140 MW for 100 MW of load; the plant runs at about \(100 \times 0.9/140 = 64\%\) average capacity factor.
- Capital and fixed costs scale with installed capacity: \(26.5 \times 140/100 = \$37.1\)/MWh of load.
- Fuel and variable costs stay about \$37/MWh (per MWh generated).
Answer: About $74/MWh rather than $63.5/MWh: redundancy adds roughly $10/MWh. Hybrid designs that use the grid or batteries for part of the redundancy, or a smaller number of larger units, can reduce this.
Total delivered cost
For grid supply, the comparison is with the total delivered cost: energy, capacity, transmission and distribution, demand charges, ancillary services, taxes and riders, minimum bills and the cost of collateral (Lessons 1, 2 and 9). For a PPA-based strategy, the delivered cost combines the utility bill with the PPA settlement (positive or negative) and any shaping or firming costs. A fair comparison builds an annual cost model for each strategy, hour by hour where prices and hourly matching matter, over the life of the decision, and converts it to a present value.
Worked problem
Comparing grid and on-site supply
For a 100 MW load, the utility's large-load tariff gives an all-in average of $78/MWh, including capacity and transmission. On-site engines with redundancy cost about $74/MWh, but the site still needs a grid connection for backup at a standby charge of $4 million a year. Which is cheaper per year at 90% load factor?
Show solution
- Energy: \(100 \times 8{,}760 \times 0.90 = 788{,}400\) MWh.
- Grid: \(788{,}400 \times 78 = \$61.5\) million. On-site: \(788{,}400 \times 74 + 4{,}000{,}000 = \$62.3\) million.
Answer: They are nearly equal, about $61.5 million against $62.3 million, so cost per MWh alone does not decide. The deciding factors are elsewhere: how soon each can supply power, fuel and carbon risk, and reliability.
Net present value and uncertainty
Decisions that unfold over years are compared by net present value (NPV): the sum of future cash flows discounted at a rate reflecting the cost of capital and risk. Because key inputs are uncertain (energization dates, gas prices, capacity prices, load ramps, technology costs), a single NPV can be misleading. Better practice:
- Sensitivity analysis: change one input at a time to see which matter most.
- Scenario analysis: define consistent futures, such as high gas and carbon prices or fast grid buildout, and evaluate each option in each.
- Monte Carlo simulation: draw inputs from distributions and compute the distribution of NPV, reporting the median, downside percentiles and probability of loss.
- Real options thinking: value the flexibility to wait, expand, switch or abandon, for example holding a site option or a queue position whose value lies in what it allows later.
The value of time to power
For AI campuses in particular, the value of operating capacity is so high that time to power often dominates every other consideration. If a megawatt of operating AI compute generates gross margin of $1 million to $2 million a year, a 200 MW campus energized a year earlier earns $200 to $400 million more, far exceeding plausible differences in energy cost. This is why developers pay premiums for sites with existing connections, accept large-load tariffs, build bridging generation and agree to flexible connections.
import numpy as np

rng = np.random.default_rng(10)
N = 10000
margin = 1.5e6                                         # gross margin per MW-year of operating AI capacity
mw = 200
# Option A: wait for the grid. Energization date uncertain: most likely 4 years, range 3 to 7.
grid_year = rng.triangular(3, 4, 7, N)
# Option B: build 200 MW of on-site engines, ready in 2 years (range 1.5 to 3), extra cost $25/MWh while running before grid
onsite_year = rng.triangular(1.5, 2, 3, N)
extra_cost_per_year = 25 * mw * 8760 * 0.9
capex_extra = 200e6                                     # capital for the bridging plant beyond backup needs (partly recoverable)
r = 0.08
def pv(start, end, amount):                             # present value of a constant annual amount from start to end
    t = np.linspace(0, 1, 50)
    return np.array([np.sum(amount * (b - a) / 50 * (1 + r) ** -(a + (b - a) * t)) if b > a else 0.0 for a, b in zip(start, end)])
gain = pv(onsite_year, grid_year, margin * mw - extra_cost_per_year)
npv = gain - capex_extra
print(f"months gained: median {np.median(grid_year - onsite_year) * 12:.0f}")
print(f"NPV of bridging power: median ${np.median(npv) / 1e6:,.0f}M; 10th percentile ${np.percentile(npv, 10) / 1e6:,.0f}M; probability negative {np.mean(npv < 0):.0%}")months gained: median 29 NPV of bridging power: median $287M; 10th percentile $88M; probability negative 2%
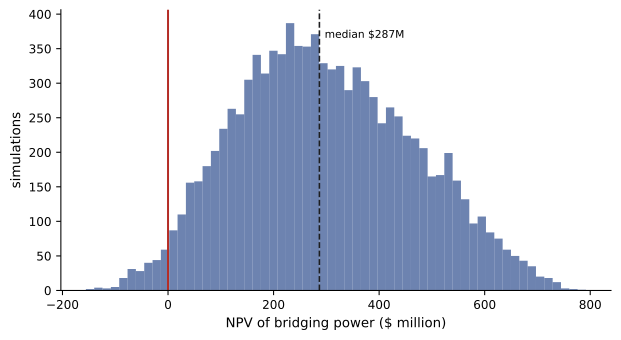
With a median gain of more than two years of operation, bridging power has a median NPV of nearly $300 million and is negative in only about 2% of scenarios, those where the grid arrives early and the bridging plant is late. The analysis also shows the main risk to manage: the bridging plant's own schedule, which depends on equipment delivery, permits and gas supply (Lessons 7 and 8). Reducing that risk, for example by securing equipment early, is worth more than reducing its cost.
Comparing long-term clean supply
Long-term options such as nuclear PPAs, geothermal and long-duration storage (Lessons 6 and 10) are compared on similar principles, with extra attention to:
- Timing: firm clean resources often arrive years after the data centre, so the comparison covers both an interim strategy and the long-term supply.
- Value beyond energy: round-the-clock carbon-free supply has value for hourly matching that LCOE does not capture; its price premium over grid power should be compared with the cost of achieving the same hourly CFE score in other ways (Lesson 6).
- Counterparty and project risk: first-of-a-kind technologies carry construction and cost overrun risk, often shared through contract structures such as fixed-price PPAs with milestone protections, equity stakes or prepayments.
- Policy risk: tax credits, carbon prices and market rules can change materially over a 20-year contract; contracts allocate this risk through change-in-law and price adjustment clauses (Lesson 9).
Worked problem
Is a nuclear premium worth it?
A nuclear PPA offers round-the-clock carbon-free power at $95/MWh for 20 years, against an expected grid cost of $75/MWh. Achieving the same 95% hourly CFE with solar, wind and storage would cost an estimated $82/MWh of load plus $8/MWh in firming and imbalance costs. Compare the premiums for a 100 MW flat load.
Show solution
- Nuclear premium over grid: \(95 - 75 = \$20\)/MWh; annual \(20 \times 876{,}000 = \$17.5\) million.
- Alternative premium: \(82 + 8 - 75 = \$15\)/MWh; annual \$13.1 million.
Answer: The renewable portfolio is about $4.4 million a year cheaper on these estimates, but its cost and CFE score are more uncertain, and it may depend on resources not yet built. The nuclear contract offers certainty of hourly matching and price; the decision depends on how the owner values that certainty and on how confident it is in the portfolio estimates.
Common mistakes
MistakeComparing options on LCOE alone.
InsteadInclude redundancy, timing, risk and value such as hourly matching.
MistakeIgnoring the standby and backup costs of on-site generation.
InsteadInclude grid standby charges and redundant units.
MistakeUsing a single NPV with uncertain inputs.
InsteadUse sensitivities, scenarios and Monte Carlo to show the range of outcomes.
MistakeUnderestimating the value of time to power.
InsteadQuantify the margin from earlier operation, often the largest factor.
MistakeAssuming capital cost estimates are stable.
InsteadCheck current equipment prices and lead times, which change quickly.
Summary and key terms
- LCOE converts capital, fixed and variable costs into a cost per MWh using the capital recovery factor.
- LCOE ignores redundancy, timing, risk and value, and short use periods raise costs sharply.
- Total delivered cost models compare grid, on-site and PPA strategies on a common basis.
- NPV with sensitivities, scenarios, Monte Carlo and real options handles uncertainty.
- Time to power often dominates: earlier operation can be worth hundreds of millions of dollars.
- Long-term clean options are compared on timing, hourly value, project risk and policy risk.
- LCOE
- Levelized cost of energy: the constant price recovering lifetime costs.
- Capital recovery factor
- The factor converting a capital cost into equal annual payments.
- Capacity factor
- Average output divided by rated capacity.
- Discount rate
- The rate used to convert future cash flows to present value.
- Net present value
- The discounted sum of future cash flows minus investment.
- Total delivered cost
- All costs of supplying power to the load, including charges and hedges.
- Monte Carlo simulation
- Repeated random sampling of uncertain inputs to estimate outcome distributions.
- Real option
- The right, but not obligation, to take a future action such as expanding or switching.
- Bridging power
- Temporary on-site generation used until a grid connection is available.
- Time to power
- The time until a data centre can be energized at its required capacity.
Practice problems
Work each problem on paper first, then reveal the answer to check.
CRF at 8% over 20 years?
Show answer
About 0.102.
Annual MWh per kW at 90% capacity factor?
Show answer
7.88 MWh.
Capital cost per MWh for $2,000/kW, CRF 0.10, CF 90%?
Show answer
\(200/7.88 = \$25.4\)/MWh.
Fuel cost at heat rate 8 and gas $4/MMBtu?
Show answer
$32/MWh.
Why does redundancy raise the effective LCOE of on-site power?
Show answer
Extra installed capacity adds capital and fixed costs per MWh served.
Name three things LCOE ignores.
Show answer
Redundancy, timing, risk, value (hourly matching, flexibility).
Value of 6 months earlier operation for 100 MW at $1.5M/MW-year?
Show answer
$75 million.
What does a 10th percentile NPV represent?
Show answer
A downside outcome exceeded in 90% of simulations.
Annual cost difference of $5/MWh for a 100 MW flat load?
Show answer
$4.4 million.
Name a real option in data centre power strategy.
Show answer
Holding a site option or queue position, or the right to expand or switch supply.
Lesson quiz · 5 questions
Score 60% or more to complete this lesson.
Create a free account to save your progress, take quizzes and earn a certificate.