
DCE-420 · Lesson 12 of 12 · 24 min
Building a power strategy: a capstone project
The previous lessons examined each element of data centre power supply: market structures and prices, interconnection, flexibility, renewable procurement, storage and firm clean power, on-site generation, gas supply, contracts, nuclear and emerging sources, and economic comparison. A real power strategy combines them over time, because no single source meets a large campus's needs for speed, cost, reliability and carbon at every stage of its life. This final lesson sets out a framework for building such a strategy and applies it to a capstone project: a 500 MW AI campus that must be energized quickly, grow over five years, and reach a high level of hourly carbon-free energy within a decade.
A framework for power strategy
A power strategy answers five questions, in roughly this order:
- How much, when and how firm? The load forecast and ramp, the reliability required (which may differ between AI training and conventional workloads, DCE-340), and how much of the load could be flexible (Lesson 4).
- Where can power be obtained, and how fast? Grid capacity and the interconnection timeline at candidate sites (Lesson 3), on-site generation options and gas supply (Lessons 7 and 8), and co-location opportunities at existing plants.
- At what cost and risk? Delivered cost of each path, exposure to energy, capacity, fuel and carbon prices, and the hedges available (Lessons 2, 9 and 11).
- How clean, and how credible? Hourly matching targets, the portfolio of renewables, storage and firm clean power that achieves them, and the accounting rules that will apply (Lessons 5, 6 and 10).
- How will it evolve? A sequence of stages, with decision points, that moves from fast initial supply to long-term supply as grid upgrades and clean firm resources arrive.
The strategy is documented as a staged plan with the contracts, permits and investments needed at each stage, the dependencies among them, and the risks and fallbacks.
The capstone project
A developer has secured a 200 ha site in a Canadian province for an AI campus ramping to 500 MW of average load over five years. The provincial utility can provide 150 MW of firm transmission service in year 3, rising to 300 MW in year 4 after a substation expansion, and 500 MW in year 6 after a new transmission line. A gas transmission pipeline crosses the site. The province has a nuclear refurbishment and uprate program, and wind and solar resources are good. The customer, a large technology company, has committed to 90% hourly carbon-free energy by year 10.
Stage 1: Bridging power (years 2 to 5)
The first building is ready in year 2, a year before any grid service. On-site reciprocating engines (chosen for speed of delivery, modularity and part-load efficiency, Lesson 7), connected to the pipeline with firm transport (Lesson 8), supply the first 100 MW, sized N+2 and paired with a battery for transient support and smoothing of AI power swings. The bridging plant is designed to transition to backup duty when grid service is firm, avoiding a stranded asset; air permits are sought for both prime and later emergency operation.
Stage 2: Flexible grid connection (years 3 to 6)
The developer signs an electric service agreement with a ramp matching realistic leasing (Lesson 9), and negotiates a flexible connection: grid service beyond the firm 150 MW and 300 MW stages, interruptible during system emergencies, with the on-site engines and batteries covering curtailment (Lesson 4). Together with the on-site plant, this lets the campus grow to 400 MW in year 5 before the new transmission line is complete; the simplified model below conservatively assumes the extra 100 MW in year 5 comes from on-site generation.
Stage 3: Clean energy procurement (years 3 onward)
Long-term PPAs for wind and solar paired with storage, in the same grid region and contracted with hourly attribute data (Lessons 5 and 6), start in year 3 and grow with the load, combined with the grid's own carbon-free share.
Stage 4: Firm clean supply (year 8 onward)
A 20-year contract for 150 MW from the nuclear uprate program, starting in year 8 (Lesson 10), fills the night-time and low-wind gaps that renewables and batteries cannot economically cover, lifting the hourly CFE score above the 90% target.
# Ten-year power plan for a campus ramping to 500 MW (annual averages; MW of average load)
load = [0, 100, 200, 300, 400, 500, 500, 500, 500, 500]
grid_cap = [0, 0, 150, 300, 300, 500, 500, 500, 500, 500]        # firm grid service available (MW)
nuclear = [0, 0, 0, 0, 0, 0, 0, 150, 150, 150]                    # MW from a nuclear PPA (restart or uprate)
grid_clean_share = 0.35                                           # carbon-free share of grid energy
ppa_clean_mwh = [0, 0, 0.4e6, 0.9e6, 1.4e6, 1.8e6, 1.8e6, 1.8e6, 1.8e6, 1.8e6]   # hourly-matched clean energy from PPAs + storage
cost = {"grid": 78, "onsite": 74, "nuclear": 95, "ppa_premium": 6}   # $/MWh
ef = {"grid": 0.40, "onsite": 0.44}                                # t CO2/MWh
print("year  load  grid  on-site  nuclear   cost $M  CO2 kt  approx CFE   (CO2 is location-based: grid energy at the average grid rate)")
for y in range(10):
    total = load[y] * 8760
    if total == 0:
        print(f"{y + 1:4d}  {0:4d}    construction only"); continue
    nuc = nuclear[y] * 8760
    grid = min(grid_cap[y], load[y] - nuclear[y]) * 8760
    onsite = total - nuc - grid
    c = (grid * cost["grid"] + onsite * cost["onsite"] + nuc * cost["nuclear"] + ppa_clean_mwh[y] * cost["ppa_premium"]) / 1e6
    co2 = (grid * ef["grid"] + onsite * ef["onsite"]) / 1e3
    clean = nuc + min(grid, ppa_clean_mwh[y] + grid * grid_clean_share)
print(f"{y + 1:4d} {load[y]:4d} {grid / 8760:4.0f} {onsite / 8760:7.0f} {nuc / 8760:7.0f} {c:8.0f} {co2:6.0f} {clean / total:9.0%}")year load grid on-site nuclear cost $M CO2 kt approx CFE (CO2 is location-based: grid energy at the average grid rate) 1 0 construction only 2 100 0 100 0 65 385 0% 3 200 150 50 0 137 718 49% 4 300 300 0 0 210 1051 69% 5 400 300 100 0 278 1437 66% 6 500 500 0 0 352 1752 76% 7 500 500 0 0 352 1752 76% 8 500 350 0 150 375 1226 96% 9 500 350 0 150 375 1226 96% 10 500 350 0 150 375 1226 96%
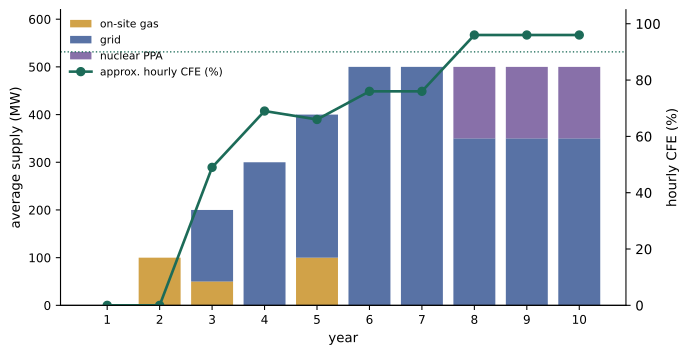
The plan energizes the first building two years earlier than grid service alone would allow, at an energy cost broadly comparable to grid supply. Emissions are highest in the early years, when on-site gas and a partly fossil grid supply most of the load, and fall sharply when nuclear supply begins. The approximate CFE score passes 90% in year 8. Each figure in the model is a simplification (hourly matching, in particular, requires the hourly analysis of Lesson 6), but the staged structure is typical of how large campuses are now planned.
Stage 5: Risks and fallbacks
| Risk | Effect | Mitigation |
|---|---|---|
| Transmission line delayed beyond year 6 | growth capped at 300 MW firm | extend flexible connection; expand on-site generation within permits |
| Engine delivery or gas lateral late | first building idle | early equipment reservation; temporary trailer-mounted generation; battery-backed partial operation |
| Nuclear uprate delayed or cancelled | CFE target missed | additional wind and storage PPAs; second firm clean option such as geothermal or hydro imports |
| Gas price spike | higher bridging cost | fixed-price gas contract for bridging years |
| Slower leasing | minimum bill exposure | phased contract capacity and ramp schedule in the ESA |
| Regulatory change on large loads | new costs or curtailment obligations | engagement with regulator; flexibility capability already in place |
| Carbon policy tightening | higher cost of gas operation | limit gas to bridging and backup; carbon capture option on larger units |
Worked problem
Testing the plan against a transmission delay
If the new transmission line slips from year 6 to year 8, the campus is limited to 300 MW of firm grid service in years 6 and 7. The flexible connection allows another 100 MW most of the time, and on-site engines can supply the remaining 100 MW. Using the model's costs ($78/MWh grid, $74/MWh on-site) and emission factors (0.40 and 0.44 t/MWh), estimate the change in annual cost and emissions in year 6.
Show solution
- Base: 500 MW from the grid: cost \(500 \times 8{,}760 \times 78 = \$341.6\) million; emissions \(500 \times 8{,}760 \times 0.40 = 1{,}752\) kt.
- Delay: 400 MW grid and 100 MW on-site: cost \(400 \times 8{,}760 \times 78 + 100 \times 8{,}760 \times 74 = 273.3 + 64.8 = \$338.1\) million; emissions \(1{,}402 + 385 = 1{,}787\) kt.
Answer: Annual cost changes little (about $3.5 million lower, ignoring the capital already committed to engines), but emissions rise by about 35 kt and the campus depends on gas generation for longer, which may strain permits limiting operating hours. The delay is manageable for cost but must be reflected in the carbon plan and permit strategy.
Presenting the strategy
A power strategy is ultimately a decision document for executives, investors and often regulators and communities. It should present:
- The load forecast and reliability requirements, with their uncertainties.
- The staged supply plan, with a timeline of energization, contracts and investments.
- Costs and risks for each stage, with scenario and sensitivity results rather than single numbers (Lesson 11).
- The carbon trajectory, with hourly CFE estimates and the accounting basis used, and how claims will be verified.
- Commitments to the community and grid: flexibility, payment of costs caused, water and noise impacts of on-site generation, and local benefits (DCE-410).
- Decision points and triggers: what will be decided when, and what would cause the plan to change.
Data centre power has changed from a utility commodity bought on a tariff into one of the most strategic and complex decisions a data centre company makes. The skills of this course, understanding markets, grids, technologies, contracts and economics together, are what make that decision well.
Lessons from recent projects
Recent large campus projects suggest some practical lessons. Equipment availability, especially for large transformers and gas turbines, has repeatedly set schedules more than permits or construction. Communities and regulators have become more demanding about who pays for new generation and transmission, so projects that bring their own resources, accept flexibility and commit to paying costs they cause gain approvals faster. Co-location at existing power plants has attracted regulatory scrutiny over its effect on other customers, making grid-connected arrangements with clear cost allocation more durable. And hourly carbon-free energy claims are being examined more closely, rewarding procurement of new, deliverable, round-the-clock clean resources over annual certificate purchases.
Common mistakes
MistakeSeeking one source to meet every need from day one.
InsteadStage supply: fast bridging power, growing grid service, and long-term clean firm supply.
MistakeBuilding bridging generation that becomes a stranded asset.
InsteadDesign it to transition to backup and plan permits for both roles.
MistakeSetting carbon targets without a credible path for the last gaps.
InsteadInclude firm clean resources or long-duration storage in the plan.
MistakePresenting a single-case plan.
InsteadTest the plan against delays and price shocks and show fallbacks.
MistakeIgnoring community and regulatory expectations.
InsteadCommit to paying costs caused, flexibility and local benefits.
Summary and key terms
- A power strategy answers how much, where, at what cost and risk, how clean, and how it evolves.
- Large campuses typically stage supply: bridging generation, flexible and then firm grid service, clean PPAs, and firm clean contracts.
- Bridging plants should transition to backup to avoid stranded assets.
- Firm clean supply fills the gaps that make high hourly CFE targets expensive.
- Risks such as transmission delays, equipment lead times and policy changes need explicit fallbacks.
- The strategy is presented as a staged decision document with scenarios, carbon trajectory and community commitments.
- Power strategy
- A staged plan for securing a data centre's electricity over its life.
- Bridging power
- Temporary supply, often on-site generation, used until grid service is available.
- Staged supply
- Supply arrangements that change over time as resources become available.
- Firm service
- Grid service without curtailment except in emergencies.
- Flexible connection
- Grid service beyond firm limits, subject to curtailment.
- Hourly CFE target
- A goal for the share of hourly consumption matched by clean energy.
- Location-based emissions
- Emissions calculated using the average emission rate of the local grid.
- Stranded asset
- An investment that loses its value before the end of its expected life.
- Decision point
- A planned time to review and commit to the next stage.
- Fallback
- An alternative ready if a planned element fails.
Practice problems
Work each problem on paper first, then reveal the answer to check.
Name the five questions a power strategy answers.
Show answer
How much/when/how firm; where/how fast; cost and risk; how clean; how it evolves.
Why are reciprocating engines common for bridging power?
Show answer
Speed of delivery, modularity and part-load efficiency.
Annual energy of a 500 MW flat load?
Show answer
4.38 TWh.
Annual cost of 350 MW at $78/MWh?
Show answer
\(350 \times 8{,}760 \times 78 = \$239\)M.
Emissions from 100 MW on-site at 0.44 t/MWh for a year?
Show answer
385 kt.
Why does nuclear supply raise the hourly CFE score so much?
Show answer
It produces around the clock, filling night and low-wind gaps.
How can a bridging plant avoid becoming stranded?
Show answer
Transition to backup duty, with permits for both roles.
Give a fallback for a delayed nuclear contract.
Show answer
Additional wind and storage PPAs or another firm clean resource.
What does a flexible connection allow during a transmission delay?
Show answer
Service beyond firm limits, with curtailment covered by on-site resources.
Name two items in a power strategy decision document.
Show answer
Staged plan, costs and risks with scenarios, carbon trajectory, community commitments, decision points.
Lesson quiz · 5 questions
Score 60% or more to complete this lesson.
Create a free account to save your progress, take quizzes and earn a certificate.