
CIV-230 · Lesson 1 of 12 · 22 min
Materials behaviour and testing basics
Every civil engineering structure is only as good as the materials it is made from. A bridge girder designed with perfect arithmetic will still crack if the concrete was mixed with too much water, rust through if the cover over the reinforcing steel is too thin, or rut under traffic if the asphalt binder softens in summer heat. Civil engineering materials is the course where you learn what these materials are, why they behave as they do, how they are specified, and how a testing laboratory proves that what arrives on site is what the designer asked for.
Throughout the course we follow the work of one testing and inspection firm. Tamarack Materials Engineering runs a laboratory and field inspection service in Saskatoon, Saskatchewan. This year the firm has three large jobs: quality assurance for a new highway interchange on the city's ring road, with a cast-in-place concrete bridge deck and new asphalt approaches; mill certificate review and inspection for the steel frame of a regional sports complex; and moisture and grading checks on the glulam and cross-laminated timber for a new public library. The laboratory is run by Amara Osei, P.Eng. Jonah Whitlock, an engineer-in-training, handles field testing and reports, and Lucie Bergeron, a co-op student, writes short Python programs to check calculations and summarize test data.
Why materials matter to a civil engineer
Structural analysis tells you the forces in a member; materials knowledge tells you whether the member can carry them for fifty or a hundred years. Most of the properties a designer uses, such as the specified compressive strength of concrete, the yield strength of steel or the bending strength of a wood grade, are not fundamental constants. They are numbers chosen by a standard-writing committee from test data, with a margin that reflects how variable the material is. Understanding where those numbers come from lets you judge when they apply and when they do not.
Materials also dominate the cost and the environmental footprint of civil works. Concrete is the most widely used manufactured material on earth, and cement production alone is responsible for several per cent of global carbon dioxide emissions. Asphalt pavements cover most of the road network. Choosing a mix, a grade or a protective system well can cut costs and emissions while extending service life, and choosing badly can lead to premature repairs that cost far more than the original savings.
Stress, strain and the stress–strain curve
Materials are compared by how they respond to load. Engineering stress is force divided by the original cross-sectional area, and engineering strain is change in length divided by original length. Plotting stress against strain for a test specimen gives the stress–strain curve, the single most useful picture of a material's mechanical behaviour.
In the initial straight portion of the curve the material is linear elastic: it returns to its original length when unloaded, and the slope is the modulus of elasticity \(E\). Beyond the proportional limit the curve bends, and beyond the elastic limit some deformation is permanent. Ductile materials such as structural steel then yield, stretching a great deal with little increase in stress, before strain hardening and eventually necking and fracture. Brittle materials such as plain concrete in tension, cast iron and glass fracture with little or no inelastic deformation.
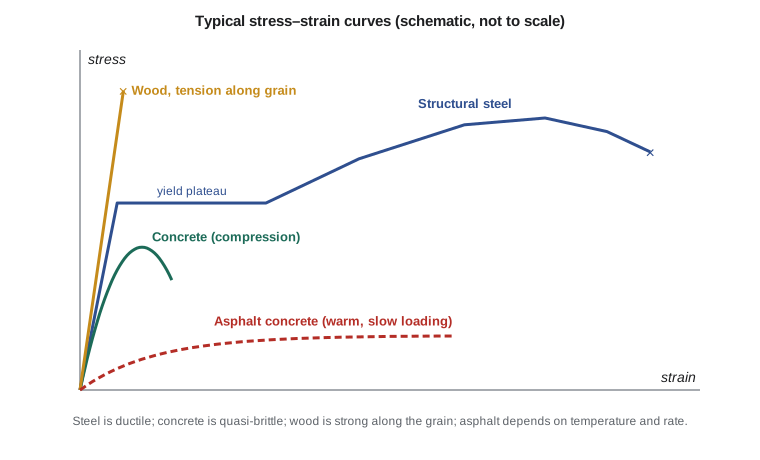
Properties read from the curve
- Modulus of elasticity (Young's modulus) \(E\): the stiffness in the linear range. Steel is about 200 GPa, normal concrete roughly 25 to 35 GPa, softwood lumber along the grain about 9 to 13 GPa, and asphalt concrete anywhere from under 1 GPa on a hot day to over 20 GPa in winter.
- Yield strength: the stress at which noticeable permanent deformation starts. For materials without a sharp yield point, it is found by the 0.2 per cent offset method: draw a line parallel to the linear portion starting at 0.002 strain and read where it crosses the curve.
- Ultimate (tensile or compressive) strength: the maximum engineering stress the specimen reaches.
- Ductility: the ability to deform inelastically before fracture, measured as elongation at fracture or reduction in area. Ductility gives warning before collapse and lets structures redistribute load.
- Toughness: the energy absorbed per unit volume up to fracture, the area under the whole curve. Resilience is the energy stored elastically, the area under the linear part.
- Poisson's ratio \(\nu\): the ratio of lateral contraction to axial extension, about 0.3 for steel and 0.15 to 0.2 for concrete.
Worked problem
Reading a steel tension test
Jonah tests a 12.5 mm diameter coupon machined from a reinforcing bar, using a 50 mm gauge length. At a load of 18.0 kN the extension is 0.036 mm. The specimen yields at 52.0 kN, reaches a maximum load of 67.5 kN and breaks with a final gauge length of 58.6 mm. Find the modulus, yield strength, tensile strength and elongation.
Show solution
- Area: \(A_0 = \pi (12.5)^2 / 4 = 122.7\ \text{mm}^2\).
- \[\sigma = 18\,000 / 122.7 = 146.7\ \text{MPa} \qquad \varepsilon = 0.036/50 = 0.000\,72\]
- \[E = 146.7 / 0.000\,72 = 204\,000\ \text{MPa} = 204\ \text{GPa}\]
- \[f_y = 52\,000/122.7 = 424\ \text{MPa} \qquad f_u = 67\,500/122.7 = 550\ \text{MPa}\]
- Elongation \(= (58.6 - 50)/50 = 17.2\) per cent.
Answer: \(E \approx 204\ \text{GPa}\), \(f_y = 424\ \text{MPa}\), \(f_u = 550\ \text{MPa}\), elongation 17 per cent: consistent with a 400-grade weldable bar, whose yield must fall in a specified band and whose tensile strength must exceed the yield by a set ratio.
Time, temperature and rate effects
The stress–strain curve is not the whole story. Many civil materials change behaviour with time, temperature and loading rate. Concrete and wood creep: under a sustained load they keep deforming for years, so a concrete beam's long-term deflection can be two or three times its immediate deflection. Concrete also shrinks as it dries, which cracks slabs if joints are not provided. Asphalt is viscoelastic: it behaves like a stiff elastic solid under a fast-moving truck in January, and like a viscous fluid that flows into ruts under a slow, heavy truck in July. Steel is the most stable of the four at ordinary temperatures, but it loses strength in fires and can become brittle at very low temperatures if its toughness is poor.
Repeated loading causes fatigue. A steel bridge detail or an asphalt pavement may carry a stress far below its static strength, yet fail after millions of cycles. Fatigue is controlled by limiting stress ranges, by choosing details that avoid sharp stress concentrations, and in pavements by designing thick enough layers to keep tensile strains at the bottom of the asphalt small.
Why test? Specifications and acceptance
A specification is the contract document that says what properties a material must have and how they will be measured. A good specification names a standard test method, a sampling plan, an acceptance criterion and what happens if the material fails. Testing laboratories such as Tamarack's exist because owners, designers and contractors need independent evidence that materials comply.
In Canada most material and test standards are published by CSA Group. Concrete is governed by CSA A23.1 (materials and methods of construction) and CSA A23.2 (test methods), now in their 2024 editions; reinforcing steel by CSA G30.18; structural steel by CSA G40.20/G40.21; and engineering design in wood by CSA O86, also in a 2024 edition. Many ASTM standards are used as well, especially for asphalt and for products made in the United States, and provincial transportation ministries publish their own specifications for highway work.
Laboratories are themselves checked. Accreditation bodies audit a lab's procedures, equipment calibration and technician training, and owners usually require that acceptance testing be done by an accredited laboratory with certified field technicians.
Variability and statistics
No two test specimens give exactly the same result. Variation comes from the material itself (aggregate gradation shifts, the water content of each truckload differs), from sampling, and from the test procedure. Specifications deal with variability by statistics. If a large set of compressive strength results is roughly normally distributed with mean \(\bar{x}\) and standard deviation \(s\), the coefficient of variation is \(s/\bar{x}\), and a value that only a small fraction of results should fall below can be computed from the normal distribution.
This is why a concrete producer must aim for an average strength well above the specified strength. If the specified strength is 35 MPa and the plant's standard deviation is 4 MPa, a mix that averages exactly 35 MPa would have half its tests below the specified value. Concrete standards therefore require a required average strength that sits roughly 1.3 to 2.3 standard deviations above the specified value, depending on which criterion governs; lesson 4 shows how. Similar logic sets the characteristic values used for steel and wood: the published strength of a wood grade is close to the fifth percentile of test results, adjusted for duration of load and other factors.
Lucie writes a short program to summarize the first batch of cylinder results from the bridge deck and estimate what fraction of future results might fall below specification if the distribution stays the same.
from statistics import mean, stdev, NormalDist

# 28-day compressive strength results (MPa), each the average of two cylinders
results = [41.2, 38.5, 44.0, 39.8, 42.6, 37.9, 40.4, 43.1, 39.0, 41.7, 36.8, 42.2]
fc_spec = 35.0

xbar, s = mean(results), stdev(results)
print(f"n = {len(results)}, mean = {xbar:.1f} MPa, s = {s:.2f} MPa, V = {100*s/xbar:.1f} %")
frac_low = NormalDist(xbar, s).cdf(fc_spec)
print(f"Estimated fraction of tests below {fc_spec} MPa: {100*frac_low:.2f} %")
print(f"Margin above specified strength: {(xbar - fc_spec)/s:.2f} standard deviations")n = 12, mean = 40.6 MPa, s = 2.24 MPa, V = 5.5 % Estimated fraction of tests below 35.0 MPa: 0.63 % Margin above specified strength: 2.50 standard deviations
With a mean of about 40.6 MPa and a standard deviation near 2.2 MPa, the margin is more than two standard deviations, so very few results should fall below 35 MPa. A dozen results is a small sample, so the estimate is rough; standards ask for at least fifteen to thirty tests before a producer's standard deviation is trusted.
Sampling: the test is only as good as the sample
A perfectly run test on an unrepresentative sample is worthless. Sampling standards say where and how to take a sample: for fresh concrete, from the middle portion of the truck discharge, never the first or last bit; for aggregate, from a flattened stockpile face or a stopped conveyor belt, combining several increments; for asphalt mix, from the paver auger or behind the paver; for steel, from the heat that the mill certificate describes. Samples must be protected and handled correctly. Concrete cylinders left in a hot truck bed or frozen overnight give low strengths that do not reflect the concrete in the structure, and arguing about such results wastes everyone's time.
Tests are classed by purpose. Quality control tests are done by the producer or contractor to run the process. Quality assurance or acceptance tests are done by or for the owner to decide whether to accept and pay for the material. Verification tests check that the two agree. On the interchange project, the concrete supplier tests its own aggregates and mixes daily, while Tamarack performs acceptance testing on the deck concrete for the province.
Units and conversions
This course uses SI units: stresses in megapascals (1 MPa = 1 N/mm²), moduli in gigapascals, densities in kilograms per cubic metre, and masses in kilograms and tonnes. You will meet US customary units in older Canadian drawings, in American product literature and in some asphalt tests, so remember that 1 MPa = 145.0 psi, 1 ksi = 6.895 MPa, 1 lb/ft³ = 16.02 kg/m³, and 1 inch = 25.4 mm.
Common mistakes
MistakeTreating a published material strength as a constant of nature.
InsteadSpecified strengths are statistical values chosen with margins; they depend on test method, sampling and acceptance rules.
MistakeReading the yield strength of a material without a yield plateau at the end of the linear portion.
InsteadUse the 0.2 per cent offset method, or the method the material standard specifies.
MistakeIgnoring creep, shrinkage and temperature because the short-term test looked fine.
InsteadConcrete, wood and asphalt change with time and temperature; long-term behaviour often governs.
MistakeAccepting a test result without asking how the sample was taken and stored.
InsteadCheck sampling location, handling and curing; a bad sample produces a meaningless result.
Summary and key terms
- Materials knowledge tells an engineer whether a member can carry its forces durably for its design life.
- The stress–strain curve gives modulus, yield and ultimate strength, ductility and toughness.
- Concrete, wood and asphalt creep and are sensitive to time and temperature; asphalt is strongly viscoelastic.
- Specifications name test methods, sampling plans and acceptance criteria; acceptance tests are done by accredited labs.
- Test results vary, so specified strengths are statistical and mixes are designed with a margin above them.
- Representative sampling and correct handling are as important as the test itself.
- Modulus of elasticity
- The slope of the linear part of the stress–strain curve; a measure of stiffness.
- Yield strength
- The stress at which significant permanent deformation begins, often found by the 0.2 per cent offset method.
- Ductility
- The capacity to deform inelastically before fracture, usually reported as elongation.
- Toughness
- The energy absorbed per unit volume up to fracture; the area under the stress–strain curve.
- Creep
- Continued deformation over time under a sustained load.
- Viscoelastic
- Behaving partly like an elastic solid and partly like a viscous fluid, depending on time and temperature.
- Coefficient of variation
- The standard deviation divided by the mean, a dimensionless measure of scatter.
- Acceptance testing
- Testing done for the owner to decide whether material meets the specification.
Practice problems
Work each problem on paper first, then reveal the answer to check.
A 100 mm diameter concrete cylinder fails at 310 kN. What is its compressive strength?
Show answer
\(A = \pi(100)^2/4 = 7854\ \text{mm}^2\), so \(f = 310\,000/7854 = 39.5\ \text{MPa}\).
What does the area under the entire stress–strain curve represent?
Show answer
Toughness: the energy absorbed per unit volume up to fracture.
Why does a concrete mix have to average more than its specified strength?
Show answer
Results scatter, so the average must sit far enough above the specified value that only a small fraction of tests fall below it.
Name two time-dependent behaviours of concrete.
Show answer
Creep under sustained load and drying shrinkage.
A set of results has a mean of 30 and a standard deviation of 3. What is the coefficient of variation?
Show answer
\(3/30 = 0.10\), or 10 per cent.
Why are the first and last portions of a concrete truck discharge not sampled?
Show answer
They are not representative; the first may be wetter or segregated and the last may contain leftover material.
Lesson quiz · 5 questions
Score 60% or more to complete this lesson.
Create a free account to save your progress, take quizzes and earn a certificate.