
BAS-420 · Lesson 2 of 12 · 24 min
Reading symptoms from trends and alarms
▶ Video coming soon A video version of this lesson is on the way.
The second tab in Prakash's trouble file is a stack of trend printouts. Each has a few pencil marks on it: a circle around a flat line, an arrow at a step, a bracket over a ripple with a number written beside it. "Most of the time," he told Callie, "the answer is already in the trends before anyone drives to site. The trick is knowing what each shape means, and knowing when the trend is lying to you." The top sheet was a printout from Tilden Hall's AHU-2 in late October: two traces of the same discharge air temperature, one sampled every 5 minutes and one every 10 seconds. The 5-minute trace looked like gentle noise. The 10-second trace showed a clean, regular swing every 96 seconds.
This lesson covers how to read trends and alarms as evidence: what to trend, how often, which shapes point to which faults, how to compare related points, and how to read an alarm history as a timeline of what went wrong first. It builds on the trend logs and alarm work from BAS-220 and BAS-320.
What a trend can and cannot tell you
A trend log is a record of a point's value over time, stored in the controller and usually collected by the front end. It can tell you when something changed, how fast it changed, whether it repeats, and how it relates to other points. It cannot tell you whether the value is true. A trend of a sensor that has drifted is a perfect record of the wrong number. A trend of a commanded output shows what the program asked for, not what the actuator did.
There are two common ways to record a trend. An interval trend takes a sample at a fixed period, such as every minute. A change-of-value trend records a sample only when the value moves by more than a set amount, called the COV increment. Interval trends are easier to compare side by side. Change-of-value trends save memory on points that rarely change, but a large COV increment can hide small oscillations, and a value that stops updating (because a sensor or a network link has failed) may simply stop producing samples without any obvious sign on the chart.
Before trusting any trend, check three things. First, the sample interval or COV increment. Second, the time stamps: is the controller's clock correct? In BAS-320, Callie saw a Ninefield controller whose clock had drifted 73 minutes before the front end was set to synchronize it. A trend from that controller would have placed every event more than an hour from where it really happened. Third, the gaps: a trend with missing samples may mean the controller was offline or restarted.
Choosing the sample interval
A trend has to sample fast enough to show the behaviour you are looking for. A useful rule of thumb is at least ten samples per cycle to see the shape of an oscillation clearly, and never fewer than two per cycle, or the oscillation can disappear or turn into a false, slower pattern. This false pattern is called aliasing. It is the same effect that makes a car wheel in a film appear to turn slowly backwards.
Worked problem
Why the 5-minute trend hid the hunting
Tilden's AHU-2 discharge air temperature was trended every 5 minutes for Gus's building report, and a fast trend every 10 seconds was added for loop work. The real oscillation had a period of 96 seconds. How many samples per cycle did each trend take?
Show solution
- Fast trend: 96 ÷ 10 = 9.6 samples per cycle, close to the ten-per-cycle rule, so the shape was clear.
- Slow trend: 5 minutes is 300 seconds; 300 ÷ 96 = 3.1 cycles pass between samples.
- With more than one full cycle between samples, the slow trend picks up the swing at a different point each time and shows it as irregular noise, or even as a slow false wave.
Answer: About 9.6 samples per cycle on the 10-second trend, and one sample every 3.1 cycles on the 5-minute trend. The 5-minute trend was fine for daily energy patterns but could not show a loop hunting at 96 seconds.
| What you are looking for | Typical interval | Notes |
|---|---|---|
| Loop tuning and hunting on air or water temperature | 1 to 10 s | Short fast trend, a few hours to a day, then delete or slow it down |
| Pressure and flow loops | 1 to 5 s | Fan static and pump differential pressure loops can cycle in under a minute |
| Comfort and zone behaviour | 1 to 5 min | Morning warm-up, afternoon sun, occupancy patterns |
| Energy and daily operation | 5 to 15 min | Schedules, runtimes, reset curves, daily totals |
| Rarely changing status points | Change of value | Fan status, mode, alarms |
Fast trends cost memory and network traffic. A controller can store only so many samples, and an MS/TP trunk can move only so much data. Set fast trends on the few points you need, for as long as you need them, and then slow them down again. On the Marlow Lane burn-in in BAS-410, the commissioning trends ran every minute on 180 points, and a separate 10-second trend on two boxes was what showed their reheat loops hunting with a period of about 230 seconds. One-minute samples gave fewer than four per cycle on that loop, enough to suspect something but not enough to see it clearly.
Trend shapes and what they usually mean
Prakash's printouts are marked with a small vocabulary of shapes. Each points toward a family of causes. None of them proves a cause on its own, but each tells you where to look next.
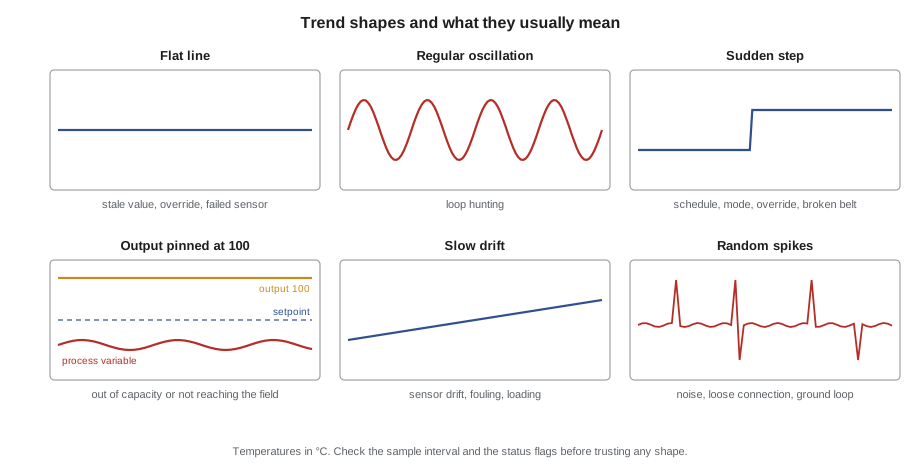
| Shape | What it often means | What to check next |
|---|---|---|
| Perfectly flat line on a sensor that should move | Failed or disconnected sensor, value overridden, controller or network offline, or a stale value | Status flags (fault, out of service, overridden), the priority array, the reliability property, a reading with your own meter |
| Regular oscillation | A loop hunting: gain too high, integral too fast, too much dead time, or a sticky actuator | Period and amplitude; whether the output swings too; recent tuning changes (lesson 9) |
| Sudden step | Something changed: a schedule, a mode, an override, a setpoint, or a mechanical event such as a belt breaking | Audit trail, schedule, other points that stepped at the same moment |
| Output pinned at 0 or 100, process variable away from setpoint | The loop has run out of capacity, or the output is not reaching the field | Is the device actually moving? Is the plant supplying hot or chilled water? Is the equipment big enough? |
| Slow drift over days or weeks | Sensor drift, fouling, filter loading, a slow leak | Compare with a second sensor or your own instrument; mechanical inspection |
| Random spikes | Electrical noise, loose connection, ground loop, induced voltage, failing sensor | Wiring, shielding and routing (lesson 4) |
Two of these shapes deserve extra attention. The first is the output pinned at a limit. A heating loop sitting at 100 with the temperature still below setpoint looks calm, and it may raise no alarm at all, but it is telling you that the controller has done everything it can. The fault is downstream: a valve that is not opening, a coil that is not getting hot water, an actuator that has lost its coupling, or a load that is bigger than the equipment. The second is the flat line. A real temperature in a working building is never perfectly still. A value that does not change in the third decimal place for hours has usually stopped updating.
Comparing related points
One trend shows a symptom. Several trends of related points, on one chart with the same time axis, often show the cause. The most useful comparisons follow the energy through the system or pair each command with its feedback.
- Command and feedback: valve command against valve position feedback, damper command against damper position, fan start command against fan status. A difference between them is a fault in the field device or its wiring.
- Upstream and downstream temperatures: supply air from the air handler against discharge air from a VAV box. If the box adds heat while its reheat valve is commanded closed, as in room 108, the valve or actuator is at fault.
- Setpoint, process variable and output together: this is the basic loop view from BAS-130. It shows whether a loop is hunting, saturated or simply tracking a changing setpoint.
- Two sensors measuring the same thing: a return air sensor in the duct and the average of the zone sensors it serves; two outdoor air sensors; a supply water temperature at the plant and at the far end of the loop.
- The equipment and its driver: a pump speed against the differential pressure it controls; a fan speed against static pressure; compressor stages against discharge air temperature.
In room 108, the comparison that mattered was the box's discharge air at about 34 °C (93 °F) against the AHU-1 supply air at 13 °C (55 °F), with the reheat command at 0. Nothing else in the building could add 21 K (38 °F) to the air between those two sensors except the reheat coil. That one chart narrowed a building-wide complaint to a single valve before anyone climbed a ladder.
Lay out the chart so that the comparison is easy to see. Put temperatures that should be compared on the same axis and scale. Put commands and feedbacks on a second axis from 0 to 100. Use a time window that covers at least one full cycle of whatever matters: a day for comfort, a few hours for a loop, a week for a schedule problem.
Reading the alarm history
An alarm history is a timeline. Read it from the oldest alarm forward, not from the newest back. When something fails, it often causes a cascade of later alarms: a supply fan stops, so the discharge air temperature goes out of range, so zone temperatures drift, so every VAV box raises a low-flow alarm. The newest alarms are the loudest and the least useful. The first alarm in the sequence is usually closest to the cause.
Some systems mark a first-out alarm on an equipment safety chain, showing which safety tripped first. Where they do not, sort the alarm list by time and look for the first abnormal event in the group. Ignore return-to-normal messages at first; they add noise. Then look at what else was happening at that time: a schedule change, a power dip, an operator action in the audit trail.
Three alarm patterns are worth knowing by sight.
- A flood: many alarms in a few minutes, usually from one cause. In BAS-320, Tilden's alarm review counted nine floods in one week. In a flood, the first one or two alarms matter and the rest are consequences.
- A chronic alarm: one point that alarms and clears again and again over weeks. Chronic alarms train people to ignore the alarm list. In Tilden's review week, three chronic points produced 790 of the 1,512 alarms. Each chronic alarm is either a real fault that nobody has fixed or a badly set limit or delay.
- A missing alarm: a fault that should have alarmed but did not. When EF-3's belts broke, no alarm came in because the current switch still saw the motor's no-load current. When an alarm you expect is missing, check its limits, its delay, whether it is disabled or suppressed, and whether the input it depends on can actually see the fault.
Worked problem
Alarm rate as a symptom
Tilden's front end logged 1,512 alarms in the week of October 12 to 18. What was the average alarm rate per hour, and what does it suggest?
Show solution
- A week has 7 × 24 = 168 hours.
- 1,512 ÷ 168 = 9.0 alarms per hour on average.
- Most alarm management guidance treats more than a handful of alarms per hour, steady, as too many for an operator to act on.
Answer: About 9 alarms per hour. At that rate the alarm list stops being a tool for finding faults, which is why the first troubleshooting step on a site like that is often to deal with the chronic alarms so that real ones can be seen.
When the data itself is the fault
Sometimes the trend or the alarm is wrong rather than the building. Watch for these signs.
- Stale values. A value that has stopped updating because of a lost network connection may still be displayed with its last good reading. Many front ends flag stale or offline values with a symbol or colour. Know how your front end shows it.
- Status flags. BACnet objects carry status flags for in alarm, fault, overridden and out of service. An analog input placed out of service by a technician keeps whatever value was written to it. If a sensor's trend went flat on the day of a service visit, check whether someone left it out of service.
- Reliability. A BACnet input that detects an open or shorted sensor sets its reliability property, for example to open loop or shorted loop. In BAS-310, the bench VAV controller's discharge air input showed open loop when the sensor was unplugged. The present value may still look reasonable.
- Clock errors. A controller with the wrong time stamps everything wrong. Compare the time of a known event, such as a scheduled start, with the trend.
- Scaling and units. A trend in the wrong units or with a wrong range can look like a fault. A return fan speed scaled for 50 Hz instead of 60 Hz reads low by a fixed fraction at every speed, as Marlow Lane's did at checkout.
When in doubt, measure with your own instrument and compare. A two-minute check with a calibrated thermometer or a meter at the terminal is worth more than an hour of arguing with a trend.
Setting up trends for a call
When a call comes in and the existing trends are not enough, set up a short troubleshooting trend before going to site, or on the first visit, so that the data is waiting when you come back. Prakash's list for a comfort or loop call is short.
- The symptom point: the zone temperature, discharge air or whatever is wrong.
- The loop: its setpoint, process variable and output, at an interval fast enough for the loop.
- The feedbacks: actuator position, airflow, fan status or speed.
- The upstream source: supply air temperature, supply water temperature, static or differential pressure.
- The drivers: outdoor air temperature, occupancy or schedule state, and anything else that might explain a daily pattern.
Note in the service report which trends you added and remove the fast ones when the call is closed, or they will fill the controller's memory and slow the network for months.
Common mistakes
MistakeReading a 5-minute trend and concluding that a loop is stable.
InsteadCheck the sample interval against the behaviour you are looking for; use a fast trend, at least ten samples per cycle, for loop problems.
MistakeStarting with the newest alarms in a flood.
InsteadRead the history from the oldest alarm forward; the first abnormal event is usually nearest the cause.
MistakeTrusting a flat trend because the value looks reasonable.
InsteadA real value always moves a little. Check status flags, reliability, overrides and whether the device is online.
MistakeTreating a commanded output trend as proof that the device moved.
InsteadCompare the command with feedback or with the effect downstream, such as the discharge air temperature.
Summary and key terms
- A trend records what the controller believes; check sample interval, time stamps and gaps before trusting it.
- Sample at least ten times per cycle to see an oscillation; fewer than two per cycle can hide it entirely through aliasing.
- Common shapes point to families of causes: flat lines, regular oscillation, steps, pinned outputs, drift and spikes.
- Comparing related points on one chart, such as command against feedback or supply against discharge, often shows the cause directly.
- Read alarm histories from the oldest alarm forward, and treat floods, chronic alarms and missing alarms as patterns with their own meaning.
- Status flags, reliability, stale values, clock errors and scaling mistakes can make the data itself the fault.
- Interval trend
- A trend that records a sample at a fixed period.
- Change-of-value trend
- A trend that records a sample only when the value changes by more than a set increment.
- Aliasing
- A false, slower pattern or apparent calm caused by sampling an oscillation too slowly.
- Saturated output
- A loop output held at its limit, usually 0 or 100, because it cannot reach setpoint.
- Alarm flood
- Many alarms in a short time, usually from one cause.
- Chronic alarm
- An alarm that repeatedly goes in and out over a long period.
- Stale value
- A displayed value that is no longer being updated from the field.
Practice problems
Work each problem on paper first, then reveal the answer to check.
A heating loop output has been at 100 all morning and the space is still below setpoint. Name three things to check.
Show answer
Whether the valve and actuator are actually moving (feedback or a look), whether hot water is available at the coil (supply temperature, pump status), and whether the load is larger than the equipment can handle, for example a door left open.
A VAV box reheat loop hunts with a period of about 230 seconds. Is a 1-minute trend fast enough to study it?
Show answer
Not really: 230 ÷ 60 is fewer than four samples per cycle. It can suggest the problem but a 10-second trend (23 samples per cycle) shows the shape.
Twenty VAV boxes on one floor raised low-flow alarms within two minutes, after a supply fan alarm. Where do you start?
Show answer
With the oldest alarm, the supply fan. The VAV alarms are consequences of losing supply air.
Lesson quiz · 5 questions
Score 60% or more to complete this lesson.
Create a free account to save your progress, take quizzes and earn a certificate.