
BAS-420 · Lesson 1 of 12 · 26 min
A troubleshooting method for controls
▶ Video coming soon A video version of this lesson is on the way.
Prakash Deshmukh keeps a binder on the shelf above his bench at Quillon that he calls the trouble file. It holds service reports, a few marked-up drawings, some trend printouts with circles drawn on them in pencil, and a page at the front that he wrote out by hand years ago and has photocopied many times since. The page is titled "How to find it" and has eight lines on it. Callie Rintoul had been at Quillon for ten weeks when he handed her the binder at the end of a shop afternoon. "You have seen most of what is in here," he said. "Room 108, the west stair transformer, the seventh-floor trunk, the lecture wing loop. You were there for a lot of it. What you have not had yet is the method that ties them together. Every one of those calls was solved the same way, even though they looked nothing alike."
This course follows that binder. It uses the faults Callie has met since September at Harcastle College's Tilden Hall, at Ninefield Tower and in the 17 Marlow Lane commissioning file, and adds the troubleshooting habits that turn a confusing call into a short one. The first lesson is the method itself. Later lessons apply it to each kind of fault: field devices, wiring and power, programs, networks, mechanical equipment that only looks like a control problem, comfort complaints, unstable loops, and the safety, reporting and customer side of a service call.
Why controls problems are hard to find
A building automation system sits between almost everything in a building. A single complaint, such as a room that is too warm, could come from a broken sensor, a loose wire, a program bug, a lost network message, a stuck damper, an empty hot water coil, a tenant's space heater or a thermostat set too high. The symptom shows up in one place, but the cause can be anywhere in a chain that runs from the plant to the zone. A technician who starts by replacing the part that looks most likely can be lucky, but more often spends a morning swapping good parts while the real fault waits somewhere else.
Controls also hide their own faults. A loop that cannot reach setpoint may still look calm on the screen because its output is pinned at 100. A sensor that has drifted 2 degrees still shows a reasonable number. A fan with a broken belt can still show status on, as Tilden's EF-3 did in early November, because its current switch only checks that some current is flowing. A program that is being overridden at a higher priority still runs every scan, and its output looks right in the logic even though it never reaches the field. The front end shows what the controller believes, not always what is true, so the method has to include a way to check beliefs against the real world.
Finally, the building keeps changing while you look at it. Weather, occupancy, schedules and other systems all move. A fault that shows up on cold mornings may be invisible at 14:00. A good method gathers data across the conditions that matter, not just the moment the technician arrives.
The eight steps
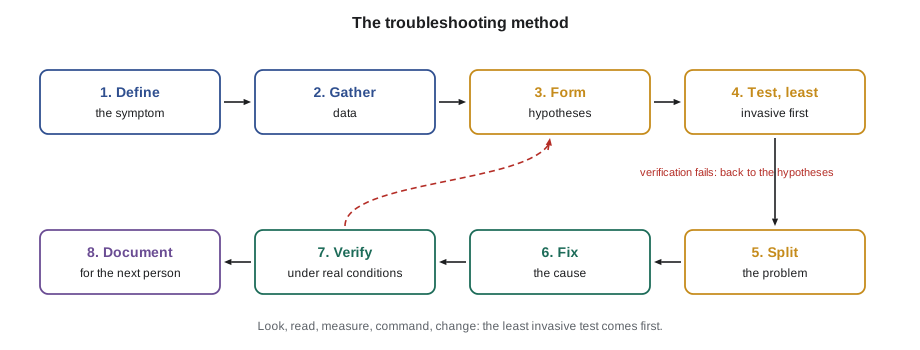
Prakash's page lists eight steps. They are not his invention; most troubleshooting guides in any trade say something similar. What matters is doing them in order and not skipping the dull ones.
| Step | What you do | Question it answers |
|---|---|---|
| 1. Define the symptom | Write down exactly what is wrong, where, when and since when, in measurable terms | What does "not working" actually mean? |
| 2. Gather data | Trends, alarms, override and change logs, the sequence, the drawings, and what people saw | What does the system already know? |
| 3. Form hypotheses | List the possible causes along the chain from plant to zone | What could produce this symptom? |
| 4. Test, least invasive first | Look before you touch; read before you write; measure before you replace | Which hypotheses survive the cheapest tests? |
| 5. Split the problem | Test in the middle of the chain to rule out half at a time | Is the fault upstream or downstream of here? |
| 6. Fix the cause | Repair the root cause, not only the symptom | Why did it happen, and will it happen again? |
| 7. Verify | Prove the symptom is gone under the conditions that caused it | Is it really fixed? |
| 8. Document | Service report, change log, backups, and lessons for the next technician | Will the next person know what was done? |
Step 1: define the symptom
Most calls arrive as a complaint, not a symptom. "Room 108 is too hot" is a complaint. "Room 108's thermostat has read 26 °C against a setpoint of 22 whenever the room is occupied since Monday morning, November 9, on grey days as well as sunny ones" is a symptom. The difference is that a symptom can be tested. It names a measurable value, a place, a time, and a start date. It also hints at what changed.
Prakash asks the same five questions on every call. What exactly is wrong? Where, and is it one room or many? When does it happen, and is there a pattern by time of day, weather or day of week? Since when, and what changed around then? Who noticed, and what did they see or do? The last question matters more than it sounds. The person who calls in often knows something important, such as the fact that the problem started after the window cleaners were on the roof, or after somebody turned a dial in a mechanical room. Ask them before you go and look.
When the symptom is vague, make it measurable before going further. For a comfort call, that might mean placing a small data logger on the desk for a day. For a loop, it means a fast trend. For a network problem, it means writing down which devices go offline and how often. A symptom you cannot measure is a symptom you cannot prove fixed.
Worked problem
Turning a complaint into a symptom
Gus Thibodeaux forwards a work order: "Tilden lecture wing drafty and cold, please fix." What should the symptom statement look like before anyone touches a controller?
Show solution
- Where: the lecture wing, served by AHU-2, not the whole building. Ask which rooms and whether it is near the diffusers.
- What: occupants feel cold air movement. Check the AHU-2 discharge air temperature trend for swings, not just the average.
- When: in the October call, the trend showed the discharge air temperature swinging between 17 and 19 °C (62.6 and 66.2 °F) every 96 seconds during occupied hours.
- Since when: the swings started after a September settings change that raised the gain to get a faster warm-up.
Answer: A usable symptom statement: "AHU-2 discharge air hunts 17 to 19 °C (62.6 to 66.2 °F) with a 96-second period during occupied hours, since the September tuning change; occupants in the lecture wing feel cold drafts." That sentence already points toward the loop and away from the occupants' thermostats.
Step 2: gather data before you touch anything
A modern BAS records a great deal. Before driving to site, a technician with remote access can usually read the alarm history, the trends, the override report, the audit trail of operator changes, and the current values of every point involved. On site, add the sequence of operations, the points list, the as-built drawings, and the service history in the job folder. Lesson 2 covers reading trends and alarms in detail. The point here is order: data first, opinions second.
People are also data. Ask the operator what they have tried. Nell Nakagawa, Harcastle's chief operator, can usually say whether a valve has been manually opened, whether a breaker tripped, or whether a contractor has been in the ceiling. Tenants can say whether the problem is worse in the morning or the afternoon. Treat what people tell you as evidence to be checked, not as a diagnosis. An occupant who says "the heating is broken" may be right about the symptom and wrong about the cause.
Check what changed. Many faults are caused by the last person who worked on the system. The room 108 call in November is a good example: the box maximum airflow had been raised from 150 to 200 L/s (320 to 425 cfm) on Wednesday, November 11, and the trends showed it. That change was not the cause of the heat, but it made the symptom worse and would have confused anyone who did not read the audit trail first.
Step 3: form hypotheses along the chain
A hypothesis is a possible cause that can be tested. The best way to list them is to walk the chain from the source of energy to the occupant. For a hot room with hot water reheat, the chain runs from the converter or boiler, through the hot water pumps and piping, to the reheat valve and actuator, the VAV box controller and its program, the airflow sensor and damper, the discharge air, the diffuser, and finally the zone sensor and the space. Each link is a place where the fault could be.
Write the list down. Then, next to each item, write the evidence that would prove or disprove it and how hard it is to get. In room 108, the list on the back of Prakash's work order included a zone sensor reading high, a program writing the reheat open, an override at priority 8, a valve actuator failing open, a valve that leaks through when closed, and a heat gain in the room such as equipment or sun. The trend showed the discharge air at 34 °C (93 °F) while the program commanded the reheat valve to 0. That single observation removed the sensor, the program and the override from the list, and left the valve and actuator.
Good hypotheses are specific. "Something wrong with the VAV box" is not a hypothesis. "The reheat valve is open even though it is commanded closed" is, because it can be tested by feeling the pipe, measuring the discharge air, or watching the actuator while commanding it.
Step 4: least invasive test first
Each test has a cost and a risk. Reading a trend costs nothing and changes nothing. Looking at an actuator's position indicator costs a ladder climb. Measuring a voltage at a terminal costs a few minutes and a small risk. Commanding an output from the front end changes the building for a while. Disconnecting a wire, replacing a part or downloading a program are the most invasive steps, because they can create new faults and they destroy evidence.
So the order is: look, then read, then measure, then command, then change. Prakash puts it more bluntly: "Do not unplug anything until you know what you expect to see when you do." A technician who changes three things at once and the problem goes away has learned nothing about which change fixed it, and has possibly introduced two new problems.
- Look: indicator lights, actuator position marks, damper linkages, gauges, filter condition, labels.
- Read: present values, trends, alarm history, priority arrays, the program's own diagnostic values.
- Measure: voltage, current, resistance, temperature and pressure with your own instruments, compared to what the BAS shows.
- Command: stroke an output from the front end, with permission, and watch the field device respond.
- Change: rewire, replace, reconfigure or download, only after the tests above point at a cause.
Every test should have a predicted result before you do it. If you command a valve to 100 and expect the discharge air to rise by at least 10 K (18 °F) within a few minutes, and it does not, you have learned something. If you command it without a prediction, you will be tempted to explain away whatever happens.
Step 5: split the problem
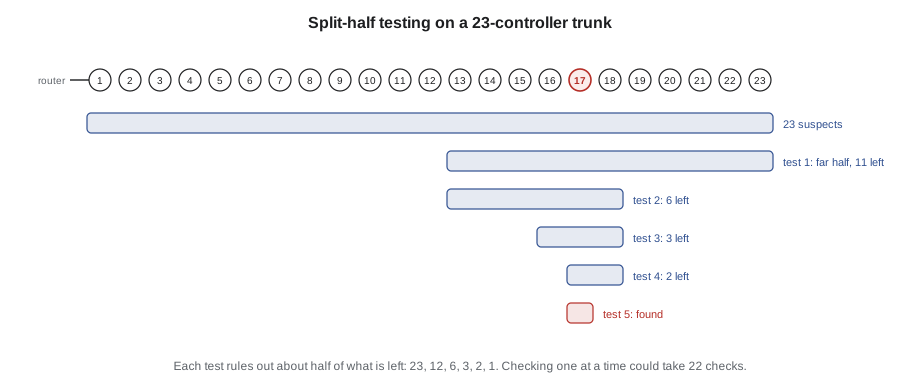
When the chain is long, test in the middle. If the controller's output terminal shows the right signal, the fault is downstream: in the wiring, the actuator or the valve. If it shows the wrong signal, the fault is upstream: in the program, the configuration or the inputs. One measurement rules out half the chain. Repeating the split narrows the fault quickly, which is why this is often called the half-split or split-half method.
The method works best on long, linear chains: a network trunk, a run of wire, a signal path from sensor to screen. On a 24 VAC circuit, measuring at the midpoint junction box tells you whether a voltage loss is before or after that point. On an MS/TP trunk, disconnecting the far half tells you whether the fault is in the near half or the far half. Lesson 6 uses it on the Ninefield seventh-floor trunk.
Worked problem
How many splits to find one bad device
A floor trunk has 23 controllers, and one of them is disrupting communication. How many split tests are needed, in the worst case, to isolate it, compared with checking each controller in turn?
Show solution
- Each split halves the number of suspect controllers, rounding up: 23, then 12, then 6, then 3, then 2, then 1.
- That is 5 splits to reach a single controller.
- Checking one controller at a time could take up to 22 checks before the last one is known to be the fault.
Answer: Five split tests in the worst case, against up to 22 one-at-a-time checks. In practice, the first split is often guided by evidence, such as which devices went offline first.
Splitting has limits. Some faults are not in a line: two faults at once, or a fault that only appears when two parts interact, such as a shared common that is fine until a second actuator moves. When a split gives a confusing result, that is evidence too. It often means there is more than one fault, or that the chain is not as simple as the drawing suggests.
Steps 6 to 8: fix, verify, document
Fixing means fixing the cause. When Prakash found the reheat actuator coupling slipping on the valve stem in room 108, the fix was to re-clamp the coupling and add a witness mark so the next person could see whether it had moved. Setting the box maximum back to design was a second fix for a second problem. Turning down the room setpoint to hide the heat would have been fixing the symptom, and the energy waste would have carried on unseen.
Root cause is worth one more question: why did it happen? A coupling slips because it was not tightened, because the set screw was on a flat that was not there, or because the actuator is undersized and working against a stiff valve. If the answer suggests that other boxes might have the same problem, the fix may include checking them, or writing a fault detection rule. After room 108, Callie wrote a rule that compares discharge air to supply air whenever the reheat valve is commanded closed, so the next slipped coupling will raise an alarm instead of a complaint.
Verification means proving the symptom is gone under the conditions that produced it. If the problem happened on cold mornings, a test at noon proves very little. Leave a trend running and check it after the next cold morning. In the AHU-2 case, the probe was moved and the loop retuned on Friday, October 30, but the case was only closed on Monday, November 2, after a full occupied period showed the discharge air holding within ±0.2 K (±0.4 °F).
Documentation is the last step and the one most often skipped. A good service report says what the symptom was, what was found, what was changed, how it was verified, and what is still open. Changes to programs or settings go in the change log with a new backup. Lesson 11 covers reports and customer communication.
Habits that make the method work
- Write as you go. Notes taken during the call are more accurate than notes written in the van. Record readings with times.
- Trust your own instruments over the screen, but check your instruments too. A meter with a weak battery or a thermometer that has not been checked can send you the wrong way.
- Change one thing at a time, and write it down before you change the next.
- Put back anything you override. A forced output left at the end of a call becomes the next call. The 14 overrides at priority 8 that Callie found in Tilden on November 14 were each somebody's test that was never released.
- Know when to stop and ask. If a test result makes no sense, describe it to someone else. Explaining it out loud often shows the flaw.
Prakash adds one more habit that is not on the page: assume the last person was competent. When a setting looks wrong, find out why it was set that way before changing it. Sometimes the strange setting is protecting something you have not discovered yet.
Common mistakes
MistakeReplacing the part that seems most likely before testing anything.
InsteadTest first, least invasive first. Replacing parts destroys evidence and can add new faults.
MistakeStarting from the controller because that is where the technician is comfortable.
InsteadStart from the symptom and walk the whole chain, from the plant to the zone, including mechanical parts.
MistakeDeclaring the problem fixed because it looks fine at the moment.
InsteadVerify under the conditions that caused it, which often means leaving a trend and checking after the next cold morning or busy afternoon.
MistakeLeaving an override in place to keep the customer happy.
InsteadRelease every override before leaving, or record it in the report with a reason and a date when it will be removed.
Summary and key terms
- Controls faults are hard to find because the symptom appears in one place while the cause can be anywhere along the chain from plant to zone, and because the BAS shows what the controller believes.
- The eight steps are: define the symptom, gather data, form hypotheses, test least invasive first, split the problem, fix the cause, verify and document.
- A symptom statement names a measurable value, a place, a time and a start date, and asks what changed.
- Test in the order look, read, measure, command, change, and predict each result before testing.
- Split-half testing rules out about half of a linear chain with each test; a confusing split often means more than one fault.
- Fix the root cause, verify under the conditions that caused the problem, and document what was done.
- Symptom
- A measurable statement of what is wrong, where, when and since when.
- Hypothesis
- A specific possible cause that can be tested.
- Least invasive test
- The test that costs least and changes least, done before more disruptive tests.
- Split-half testing
- Testing at the middle of a chain to rule out half of it at a time.
- Root cause
- The underlying reason a fault happened, which must be fixed to stop it coming back.
- Verification
- Proof that the symptom is gone under the conditions that caused it.
Practice problems
Work each problem on paper first, then reveal the answer to check.
Rewrite "the office is freezing" as a symptom statement. What do you need to find out?
Show answer
Which office, the measured temperature and setpoint, the times it happens (for example, cold mornings only), when it started, and what changed. For example: "Room 214 measures 19 degrees operative temperature at 8:00 on cold mornings with the thermostat reading 22, since the cold weather started."
Why should you predict the result of a test before doing it?
Show answer
So the result can prove or disprove a hypothesis. Without a prediction, it is easy to explain away whatever happens.
A controller output terminal shows the correct 2 to 10 V signal, but the valve does not move. Which half of the chain is ruled out?
Show answer
The upstream half: the program, inputs and output configuration. The fault is in the wiring from the terminal, the actuator, the linkage or the valve.
Lesson quiz · 5 questions
Score 60% or more to complete this lesson.
Create a free account to save your progress, take quizzes and earn a certificate.