
BAS-330 · Lesson 2 of 12 · 26 min
Utility bills, rates and demand charges
▶ Video coming soon A video version of this lesson is on the way.
Thursday, October 15 had been a long day for Callie: in the morning she and Prakash had watched Ninefield's secondary chilled water pumps hunt between 44 and 58 Hz while they chased a filter setting in the pump loop. In the evening Declan laid Ninefield's July 2026 electricity bill on the table at Quillon's office. "Most technicians never see one of these," he said. "Then they wonder why the owner cares about a fan that starts fifteen minutes early. Once you can read a bill, you know which minutes cost money."
What a commercial bill charges for
A house is billed mostly for the energy it uses. A commercial building of any size is billed for several separate things, and the control system affects each one differently.
| Charge | Based on | How the BAS affects it |
|---|---|---|
| Energy (commodity) | kWh used in the billing period, sometimes by time of day | Run hours, setpoints, efficiency |
| Demand | The highest average kW in any 15-minute (sometimes 30-minute) interval | Start-up staging, demand limiting, avoiding coincident loads |
| Delivery or distribution | Often a mix of kWh, kW and a fixed monthly charge | Partly through kWh and kW |
| Transmission and capacity | Often the building's demand at the system's peak hours | Load shedding on the utility's peak days |
| Power factor | Reactive power, when the tariff includes it | Indirectly; correction is an electrical job |
| Fixed charges, regulatory charges, taxes | Per month or per kWh | Little |
The details differ between utilities and between rate classes, and they change from year to year, so an energy manager always works from the current tariff for the actual account. What does not change is the structure: energy, demand and fixed charges, plus the charges that depend on when the building uses power.
Electricity bills in Ontario
Ninefield's electricity is delivered by Alectra Utilities, the local distribution company for Hamilton. Its bill has the usual sections, with one Ontario feature that matters a great deal to large customers: the Global Adjustment.
- Delivery charges cover the distribution company's wires, transformers and meters, and the provincial transmission system. For a building of Ninefield's size, much of this is billed per kW of monthly peak demand.
- The commodity charge covers the electricity itself, at the hourly market price or a contract price.
- The Global Adjustment covers the cost of the province's generation contracts, nuclear and conservation programs that the market price does not cover. It is often the largest single item on a large customer's bill.
- Regulatory charges, a fixed monthly service charge and HST make up the rest.
Class A and Class B: the Global Adjustment
How the Global Adjustment is billed depends on the customer's class. Most commercial buildings, including Ninefield, are Class B: they pay the Global Adjustment as a rate per kWh that changes monthly, so it behaves like an extra energy charge. Larger customers can be Class A. Customers with an average peak demand above 5 MW are Class A automatically unless they opt out, those between 1 and 5 MW can opt in, and certain manufacturing and industrial customers between 500 kW and 1 MW can also opt in. The opt-in deadline is June 15 each year.
A Class A customer pays a share of the provincial Global Adjustment equal to its share of Ontario's demand during the five highest peak hours of a base period that runs from May 1 to April 30. Its peak demand factor then sets its Global Adjustment charges for the following July to June. The peak hours from May 2025 to April 2026, which set charges from July 2026 to June 2027, fell on hot summer afternoons in June, July and August 2025. A Class A customer that cuts its load during the five peak hours can cut its Global Adjustment for a whole year, which is why large customers watch the IESO's peak forecasts closely.
Ninefield is well below 1 MW, so it is Class B, and the lesson for Ninefield is simpler: every kWh saved also saves the Global Adjustment rate on top of the energy price. Callie checked her own home bill that night; the Global Adjustment was in there too, hidden in the residential prices.
Ontario's electricity market was redesigned in 2025, when the IESO's market renewal replaced the old two-schedule system with a single schedule and a day-ahead market. The bill sections a building owner sees changed little; the details of how prices are formed did.
Demand charges
The demand on a bill is the highest average power the building drew over any single demand interval during the billing period, usually 15 minutes. The meter divides the energy used in each interval by its length, and keeps the highest result.
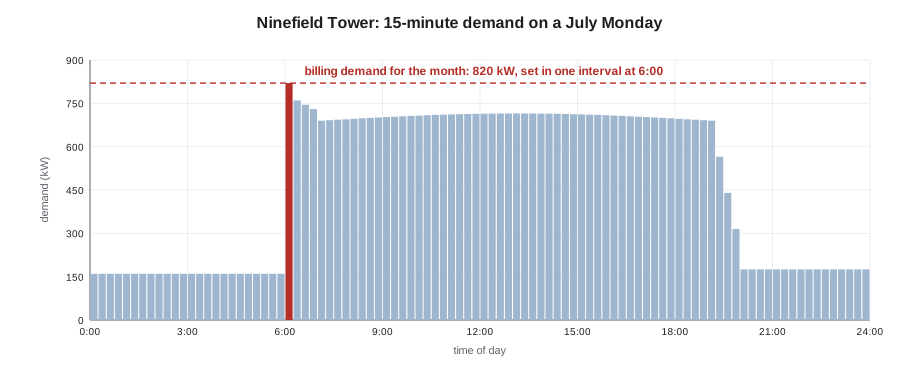
One interval sets the charge for the month. If every piece of equipment in the building starts at once on one morning, that 15 minutes can cost more than all the hours of steady operation that follow. Some tariffs add a ratchet: the billed demand for each month is at least some fraction of the highest demand in the previous eleven months, so a single bad interval can be billed for a year.
Worked problem
Ninefield's July demand charge
Ninefield's July 2026 bill shows 260,000 kWh and a peak demand of 820 kW. Using a sample demand rate of 11.50 dollars per kW per month, find the demand charge and the saving if staggered starts lowered the peak by 60 kW.
Show solution
- Demand charge: 820 kW × 11.50 = 9,430 dollars for the month.
- With a 760 kW peak: 760 × 11.50 = 8,740 dollars.
- Saving: 60 × 11.50 = 690 dollars a month.
Answer: The demand charge is about 9,430 dollars a month, and a 60 kW reduction saves about 690 dollars a month, or roughly 8,000 dollars a year if it holds every month. These rates are examples only; the real rate comes from the tariff.
Declan pointed out the trap in the chart: Ninefield's July peak was not set on a hot afternoon but at 6:00 on a Monday, when the chillers, all four penthouse air handlers and the four podium rooftop units all started within a few minutes of each other after the weekend. That kind of peak can be removed with a few lines of logic, which is the subject of lesson 6.
Load factor
Load factor compares the average demand with the peak demand over a billing period. It tells you how much of the demand you are paying for is being used.
A load factor of 1 would mean the building drew its peak all month. Office buildings typically run between 0.35 and 0.55 because they are empty at night and on weekends. A low load factor with a sharp peak is a sign that demand control would pay; a low load factor with a broad peak usually points to the schedule instead.
Time-of-use and hourly prices
Some customers pay energy prices that vary by time of day. In Ontario, smaller customers on the regulated price plan can choose time-of-use prices, and larger Class B customers usually pay the hourly market price plus the Global Adjustment. Where prices vary, the control system can help by shifting flexible loads, such as precooling a building in the early morning or charging thermal storage overnight, into cheaper hours.
Shifting saves money without necessarily saving energy; precooling often uses slightly more energy in total. That is a fair trade if the price difference is large enough, and a poor one if it is not, so it should be checked against the actual rates before it is programmed.
Power factor
Motors and transformers draw reactive current in addition to the current that does useful work. The ratio of real power (kW) to apparent power (kVA) is the power factor. Some tariffs bill demand in kVA, or bill the greater of the kW demand and a fraction of the kVA demand.
Worked problem
A power factor adjustment
A tariff bills the greater of the kW demand and 90 in 100 of the kVA demand. Ninefield's peak is 820 kW. What is billed at a power factor of 0.92, and at 0.85?
Show solution
- At PF 0.92: kVA = 820 ÷ 0.92 = 891 kVA; 0.90 × 891 = 802 kW, less than 820, so 820 kW is billed.
- At PF 0.85: kVA = 820 ÷ 0.85 = 965 kVA; 0.90 × 965 = 868 kW, more than 820, so 868 kW is billed.
Answer: At 0.92 there is no penalty; at 0.85 the building pays for 48 kW it did not use. Correcting power factor with capacitors is an electrical project for a licensed electrician, but the BAS can trend it from the main meter so that a problem is noticed.
Natural gas bills
Ninefield's gas is delivered by Enbridge Gas, the distributor in Hamilton. A commercial gas bill charges for the gas itself by volume (in cubic metres), for delivery, storage and transportation, a fixed monthly charge, the federal and provincial charges that apply, and HST. The federal consumer fuel charge was removed on April 1, 2025, which lowered gas bills noticeably. Larger customers can buy gas from a marketer at a contract price while the distributor still delivers it.
Gas bills rarely have demand charges for buildings of Ninefield's size, so the control strategies that reduce gas use are the ones that reduce heating load or improve boiler efficiency: outdoor air control, scheduling, hot water reset and keeping condensing boilers condensing.
Reading a bill in practice
Declan's checklist for any new bill was short.
| Check | Why |
|---|---|
| Is the meter read actual or estimated? | An estimated read makes the month meaningless for analysis |
| How many days are in the billing period? | A 34-day bill is not comparable with a 28-day bill without dividing by days |
| What set the demand, and when? | Interval data from the utility or the BAS meter shows the interval |
| What is the load factor? | A low load factor points to demand or schedule problems |
| Has the rate class or tariff changed? | A change can raise costs with no change in use |
| Do the BAS meter totals match the bill? | A difference of more than a few parts in 100 means a meter or scaling problem |
Callie compared the July bill with PM-1's trend log. The bill showed 260,000 kWh; the BAS meter totalled 257,900 kWh for the same days, a difference of less than 1 in 100. The peak on the bill matched the 6:00 interval on Monday, July 20 exactly. "Good," Declan said. "Now we can trust the meter for the things the bill does not show."
What one kWh saved is worth
An average price per kWh, the total bill divided by the total kWh, is a poor guide to what a saving is worth, because many charges do not change when the building uses a little less. The value of a saved kWh is the sum of only those charges that are billed per kWh: the energy itself, any per-kWh delivery charges, and the per-kWh items that vary with use. Demand charges change only if the saving happens during the interval that sets the peak, and fixed charges do not change at all.
Worked problem
The marginal value of a kWh at Ninefield
Using sample rates, Ninefield's July bill has an energy price of 0.035 dollars per kWh, a Global Adjustment of 0.06 dollars per kWh, per-kWh delivery and regulatory charges of 0.035 dollars per kWh, demand charges of 11.50 dollars per kW, and fixed charges. What is a kWh saved at 2:00 worth, and what is a kW of peak reduction worth?
Show solution
- A kWh at 2:00 saves only the per-kWh charges: 0.035 + 0.06 + 0.035 = 0.13 dollars.
- A kW removed from the peak interval saves 11.50 dollars for the month, plus the kWh it avoids during that interval.
- The average price on the bill, total cost divided by 260,000 kWh, is higher than 0.13 because it spreads the demand and fixed charges over every kWh.
Answer: About 0.13 dollars per kWh saved at night, and 11.50 dollars per kW of peak removed. Using the average price to value a night-time saving would overstate it.
This is why the Ninefield proposal in lesson 12 values energy, gas and demand separately, each at its own rate. It is also why a measure that saves energy at night, such as cutting the base load, and a measure that cuts the morning peak are worth very different amounts per kWh, even though both appear on the same bill.
Getting the utility's interval data
Alectra, like most Ontario distributors, offers commercial customers their interval data through an online portal, and Ontario's Green Button rules require distributors to make customers' data available in the standard Green Button format. With Ilona's authorization, Declan downloaded a year of Ninefield's 15-minute data, which gave him a baseline long before PM-1 had a year of its own.
Utility interval data is the authoritative record of what was billed, so it settles arguments about when the peak occurred. It usually arrives a day or more late, which is why the BAS's own meter is still needed for anything that has to respond in real time, such as demand limiting. The two should agree within a part or two in 100, as PM-1 and the July bill did.
Common mistakes
MistakeCalculating savings using an average price per kWh for everything.
InsteadSeparate energy, demand and fixed charges; a saving in kWh does not reduce a fixed charge, and a demand saving depends on when it happens.
MistakeAssuming the peak is always on the hottest afternoon.
InsteadLook at the interval data; morning starts often set the peak.
MistakeUsing last year's rates in a savings estimate.
InsteadRates change; use the current tariff and state the date of the rates used.
MistakeComparing bills with different numbers of days.
InsteadDivide by the days in the period, or use calendar-month data from the meter.
MistakeIgnoring an estimated meter read.
InsteadCheck the read type; analyze actual reads only.
Summary and key terms
- Commercial electricity bills charge for energy, demand, delivery and fixed items separately.
- In Ontario, Class B customers pay the Global Adjustment per kWh; Class A customers pay according to their share of the five provincial peak hours.
- Demand is the highest average kW in any demand interval, and one interval sets it for the month.
- Load factor compares average and peak demand; offices typically run 0.35 to 0.55.
- Some tariffs penalize low power factor by billing on kVA.
- Always work from the current tariff and check the BAS meter against the bill.
- Demand
- The highest average power over any one demand interval in a billing period.
- Demand interval
- The period over which demand is averaged, usually 15 minutes.
- Ratchet
- A tariff rule that bills at least a fraction of a previous peak.
- Load factor
- Average demand divided by peak demand over a period.
- Power factor
- Real power divided by apparent power.
- Global Adjustment
- An Ontario charge covering generation and program costs not covered by the market price.
- Class A
- Ontario customers billed the Global Adjustment by their share of the five provincial peak hours.
- Time-of-use pricing
- Energy prices that vary with the time of day.
Practice problems
Work each problem on paper first, then reveal the answer to check.
A building uses 90 kWh in a 15-minute interval. What is the demand for that interval?
Show answer
90 ÷ 0.25 = 360 kW.
A month of 720 hours has 180,000 kWh and a 500 kW peak. What is the load factor?
Show answer
180,000 ÷ (500 × 720) = 0.50.
The peak is 600 kW at a power factor of 0.80. What is the kVA?
Show answer
600 ÷ 0.80 = 750 kVA.
Why might an energy manager prefer BAS meter data to the bill for finding what set the peak?
Show answer
The BAS has 15-minute interval data for every day; the bill shows only the result.
Name two control strategies that lower gas bills.
Show answer
Scheduling and setback, outdoor air control, hot water reset, keeping condensing boilers condensing.
Lesson quiz · 5 questions
Score 60% or more to complete this lesson.
Create a free account to save your progress, take quizzes and earn a certificate.