
BAS-320 · Lesson 6 of 12 · 26 min
Trends, histories and reports
▶ Video coming soon A video version of this lesson is on the way.
Callie and Sophie spent the afternoon of Monday, October 26 building RTU-1's database, with every point named and tagged for the Ninefield front end. In the evening, Sophie opened Harcastle's front-end server remotely to show Callie where all the trend data ends up. Nine days earlier, on Saturday, October 17, they had set up Gus Thibodeaux's energy trends on Tilden's two air handlers, 40 points every 5 minutes, sized so that the controllers' buffers never wrapped before the server collected them. BAS-220 worked through that sizing. "That was the controller end," Sophie said. "Tonight is the other end: what the server keeps, for how long, and what anyone does with it."
Trend logs and histories
The words are used loosely, but there is a useful distinction. A trend log is the record a controller keeps of a point's values, in its own memory, as BAS-220 described: a buffer of a fixed size that wraps around when full. A history is the long-term record the management level keeps, built by collecting trend logs from the controllers, or by the supervisory controller or server sampling points itself, and storing them in a database.
| Trend log in a controller | History at the management level | |
|---|---|---|
| Where it lives | The controller's memory | The supervisory controller's storage, then the server's database |
| Size | Fixed buffer, often hundreds to a few thousand samples | Limited by disk space, often years |
| Survives a network failure? | Yes, until the buffer wraps | Gaps appear unless the controller buffers are collected afterward |
| Who uses it | Technicians tuning or troubleshooting | Operators, managers, energy analysts, commissioning agents |
When a network or server outage interrupts collection, a well-designed system backfills: once the connection returns, the server reads whatever the controllers' buffers still hold and fills the gap in the history. That only works if the outage is shorter than the time a buffer takes to wrap. Histories sampled by the server itself, rather than collected from controller trend logs, cannot be backfilled at all, which is why Sophie preferred controller trend logs for anything an owner might later need to prove.
How samples are taken
Histories record values in one of two ways, and a chart has to be read differently for each.
- Interval sampling records the value every fixed period, such as every 5 or 15 minutes. It is simple and makes regular data that is easy to average and compare, but it can miss short events between samples.
- Change-of-value sampling records the value whenever it changes by more than a set amount, and for binary points, whenever it changes state. It captures events exactly and stores nothing when the value is steady, but the samples are irregular.
A chart of interval data is usually drawn by joining the samples with straight lines. A chart of change-of-value data should be drawn as steps: the value stayed where it was until the next change. Joining change-of-value samples with sloping lines suggests the value moved gradually when it actually jumped, and a fan status drawn that way appears to have been half-on for hours. Most front ends let the user choose; Sophie set binary points and COV histories to step by default on every site.
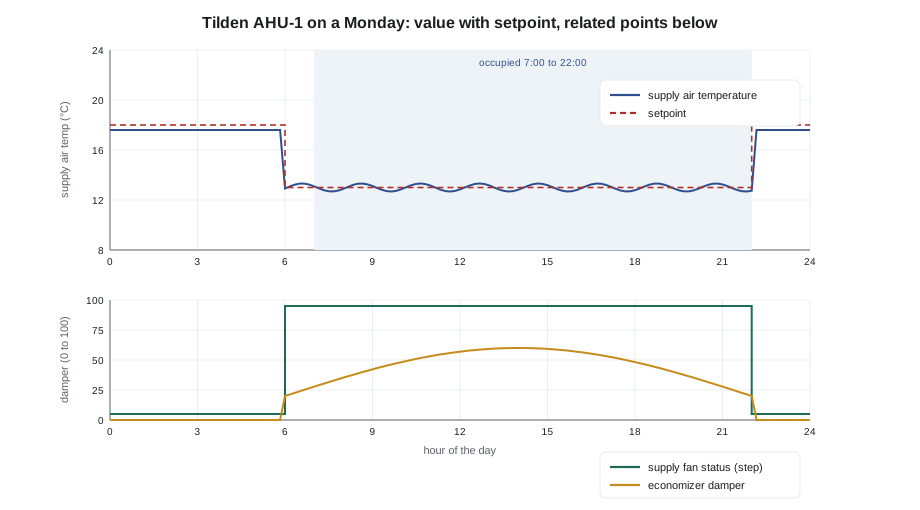
Reading a trend chart well
Trend charts are the most powerful diagnostic tool on the front end, and the easiest to misread. Sophie's rules for building and reading one were short.
| Rule | Why |
|---|---|
| Put a value and its setpoint on the same axis | The error is then visible directly; on two axes it can be hidden by the scaling |
| Put related points in stacked panels with a shared time axis | Cause and effect line up vertically: a valve opens, then the temperature rises |
| Fix the scale to a sensible range | Automatic scaling makes a 0.2 degree wobble look like a crisis |
| Show binary points as steps | They have no in-between state |
| Look at enough time | A day for a daily pattern, a week for schedules, a season for resets |
| Check the sample interval | A 15-minute history cannot show a 2-minute hunting loop |
The last rule explains a common trap. A loop hunting with a period of a minute or two, like the ones BAS-130 described, looks perfectly steady in a 15-minute history, because each sample lands at a random point in the swing. A conclusion drawn from a 15-minute history, such as "the loop was stable", can be wrong. When a complaint suggests something fast, the first step is to set up a short-interval trend on the loop for a day, which is what the 10-second trend on AHU-2's discharge air loop was for.
Worked problem
Can the history show it?
A discharge air loop is suspected of hunting with a period of about 90 seconds. The history samples it every 15 minutes. How many samples fall in one cycle, and what interval would show the shape of the swing with at least 9 samples per cycle?
Show solution
- Samples per cycle at 15 minutes: 90 ÷ 900 = 0.1, one sample every ten cycles.
- For 9 samples per cycle: 90 ÷ 9 = 10 s.
Answer: The 15-minute history takes one sample every ten cycles, so the hunting is invisible. A 10-second trend shows it clearly, which is why Sophie set AHU-2's discharge air trend to 10 seconds on October 17.
How much the server keeps, and for how long
Server storage is cheap, but not infinite, and histories are usually the largest thing on a front-end server's disk. A history database grows with the number of points, the sample rate, the bytes stored per sample and the number of years kept. Sophie's concern about Harcastle's disk, which had reached 80 in 100 full in September, came from exactly this.
Worked problem
Why Harcastle's disk filled
When Harcastle's newer buildings were commissioned in 2019, about 900 points were trended every minute for the commissioning agent, and nobody changed the interval afterward. Each stored sample takes about 12 bytes. How much storage have those histories used by late 2026, about seven years later? Compare with the same 900 points at 15-minute intervals.
Show solution
- Samples per point per year at 1 minute: 1,440 × 365 = 525,600.
- Bytes per year: 900 × 525,600 × 12 = 5,676,480,000, about 5.7 GB.
- Seven years: 5.7 × 7 ≈ 39.7 GB.
- At 15 minutes the samples are 15 times fewer: 39.7 ÷ 15 ≈ 2.6 GB.
Answer: About 40 GB of one-minute data nobody had looked at since commissioning, on a server with a 120 GB disk shared with the operating system, the front end, backups and logs. Sophie's plan was to archive the old one-minute data, keep hourly averages of it, and reset those points to 15 minutes.
The general answer is a retention policy, agreed with the owner, that keeps detailed data for as long as it is likely to be needed and summaries for longer. Many front ends can do this automatically with rollups: from raw data, they calculate hourly or daily averages, minimums and maximums, keep those, and delete the raw data after a set time.
| Data | Kept for | Used for |
|---|---|---|
| Raw interval and COV data | 13 months | Troubleshooting, comparing this month with the same month last year |
| Hourly averages, minimums and maximums | 5 years | Seasonal comparisons, energy studies, retro-commissioning baselines |
| Daily totals of energy and runtime | Life of the building | Long-term trends, benchmarking |
| Short-interval troubleshooting trends | Until the problem is fixed, then deleted | Loop tuning, diagnosing hunting or cycling |
Thirteen months, rather than twelve, is a common choice for raw data because it always includes the same month last year. Owners who might need data for an energy incentive, a lawsuit or a warranty claim sometimes ask for longer; the policy should say so in writing, so that nobody deletes it by accident.
Reports
A report is a history turned into an answer to a question that someone asks regularly. Front ends can usually produce them on a schedule and e-mail them, so that a facilities manager receives a weekly summary without opening the front end at all. The most useful reports in buildings are not complicated.
| Report | What it shows | Who reads it |
|---|---|---|
| Override report | Every point held at an operator priority or out of service, with how long | Chief operator, weekly |
| Alarm summary | Counts by class, the top ten, floods, stale alarms | Chief operator and the alarm review, monthly |
| Runtime report | Hours each major fan, pump and compressor ran, against its schedule | Facilities manager, weekly |
| Energy report | Meter readings by day and week, against weather and last year | Energy manager, monthly |
| Comfort report | Zones outside their band, and for how long | Facilities manager, weekly |
| Offline devices | Controllers not responding | Service contractor, daily |
Tilden's first scheduled override report, once Sophie set it up, would have shown the two boxes held at maximum since the summer within a week of the heat wave, rather than in November. A runtime report would have shown the same thing from another angle.
Worked problem
A runtime report against the schedule
Tilden's AHU-1 is scheduled for 84 hours a week: 7:00 to 22:00 on weekdays and 8:00 to 17:00 on Saturdays. The runtime report for the week of October 12 shows the supply fan ran 97.5 hours. Of that, the morning warm-up, which starts the fan up to an hour before occupancy on cold mornings, accounted for 5.5 hours. Where did the rest come from, and how much is it?
Show solution
- Scheduled hours: 5 × 15 + 9 = 84 h.
- Accounted for: 84 + 5.5 = 89.5 h.
- Unexplained: 97.5 − 89.5 = 8 h.
Answer: Eight hours a week that the schedule does not explain. The history showed the fan running until 2:00 on Wednesday and Thursday nights, after an evening event, because someone had used the front end to extend occupancy and set the end time to the next morning instead of 22:00. Lesson 8 shows how after-hours requests should work.
Exporting and sharing data
Sooner or later someone wants the data outside the front end: an energy consultant, a commissioning agent, an engineer designing a replacement, or an analytics platform. Every front end can export histories, usually to comma-separated files, and many can share them continuously through an interface. Three things make exported data useful rather than confusing.
- Clear point names and units in the file, so the reader knows that TH.AHU1.SAT is a supply air temperature in degrees Celsius.
- Time stamps with the time zone, or in UTC, so that data from different systems lines up, especially across a daylight saving change.
- A note of how the data was sampled, interval or change of value, and any gaps.
The analytics platforms that lesson 9 and BAS-330 describe read histories continuously and look for patterns automatically. They depend on exactly the same things: consistent names, tags, units and time stamps. A front end whose histories are well named and well kept is ready for them; one with 900 untouched one-minute trends from 2019 is not.
By the end of the evening, Callie had written the retention policy table into a draft for Gus and drawn up a list of the eleven Tilden points that should have short-interval trends until their problems were fixed, starting with AHU-2's discharge air. Sophie added one line at the bottom: "Delete the short trends when the problem is fixed."
Trends for troubleshooting: a short routine
Sophie ended the evening with the routine she used when a call came in about a space that was too warm or too cold. It works on any front end, because it uses only the trend tools every system has.
| Step | What to plot | What it tells you |
|---|---|---|
| 1 | Space temperature and its active setpoint for the last three days | Whether the complaint is a single event, a daily pattern or a steady offset |
| 2 | The zone's damper or valve output on the same chart | Whether the controller was asking for more and not getting it, or not asking at all |
| 3 | Supply air temperature and static pressure from the air handler | Whether the air handler was delivering what the zone needed |
| 4 | Occupancy mode and schedule state | Whether the zone was in the mode people assumed it was in |
| 5 | Outdoor air temperature | Whether the problem follows the weather |
The order matters. Most comfort calls are answered at step 1 or 2: a setpoint that someone changed, or a box that was at full flow and still could not keep up. Going straight to the air handler skips the cheapest answers. If a point needed for the routine has no trend, that is a finding in itself, and the point goes on the list to be added to the site's trend set, with its interval chosen by the rules earlier in this lesson.
Callie tried the routine the next morning on a complaint from a Tilden classroom. Step 1 showed the room 2 K warm every afternoon for three days, with the setpoint unchanged. Step 2 showed the box at full cooling flow from 13:00 onward. Step 3 showed the supply air temperature drifting up in the afternoons, which pointed to the air handler, not the zone. She had the answer in a quarter of an hour without leaving the office.
Common mistakes
MistakeDrawing change-of-value data with sloping lines.
InsteadDraw COV and binary histories as steps.
MistakeJudging a fast loop from a 15-minute history.
InsteadSet up a short-interval trend when a fast problem is suspected.
MistakeLeaving commissioning trends at one-minute intervals forever.
InsteadReturn them to normal intervals after commissioning and delete short trends when done.
MistakeKeeping everything with no plan.
InsteadAgree a retention policy with the owner, with rollups for long-term data.
MistakeExporting data without units or time zones.
InsteadInclude point names, units, time zone and sampling method in every export.
MistakeWaiting for a complaint to find overrides.
InsteadSchedule a weekly override report.
Summary and key terms
- Trend logs live in controllers; histories are kept long term at the management level.
- Backfill fills gaps after an outage, if controller buffers have not wrapped.
- Interval sampling gives regular data; change-of-value sampling captures events and should be drawn as steps.
- Good charts put a value and its setpoint on one axis and stack related points on a shared time axis.
- History storage grows with points, sample rate, bytes per sample and years kept.
- A retention policy with rollups keeps detail while it is useful and summaries for longer.
- Scheduled reports answer regular questions: overrides, alarms, runtime, energy, comfort and offline devices.
- History
- A long-term record of a point's values kept at the management level.
- Backfill
- Filling a gap in a history from controller buffers after an outage.
- Interval sampling
- Recording a value every fixed period.
- Change-of-value sampling
- Recording a value only when it changes by a set amount.
- Rollup
- A summary, such as an hourly average, calculated from raw history data.
- Retention policy
- An agreed rule for how long each kind of history is kept.
- Runtime report
- A report of how long equipment ran, usually compared with its schedule.
- Export
- Copying history data out of the front end, often as a comma-separated file.
Practice problems
Work each problem on paper first, then reveal the answer to check.
A history samples every 5 minutes. Can it show a loop hunting with a 60-second period?
Show answer
No: one sample every five cycles; a 5 or 10 s trend is needed.
500 points at 15 minutes, 12 bytes a sample: storage per year?
Show answer
500 × 96 × 365 × 12 = 210,240,000 bytes, about 210 MB.
Why keep 13 months of raw data rather than 12?
Show answer
So the same month last year is always included.
A fan scheduled 60 h ran 71 h with 3 h of warm-up. How many hours are unexplained?
Show answer
71 − 63 = 8 h.
Name three things an exported history file should include.
Show answer
Point names, units and the time zone; also the sampling method and gaps.
Lesson quiz · 5 questions
Score 60% or more to complete this lesson.
Create a free account to save your progress, take quizzes and earn a certificate.