
AWS-122 · Lesson 10 of 12 · 18 min
Tracking adoption and outcomes
▶ Video coming soon A video version of this lesson is on the way.
Lorraine's favourite question was "How will we know?" The strategy course had answered part of it with KPIs, baselines and comparison groups for each initiative. In the ninth session she asked it about the transformation as a whole. "Suppose every project hits its numbers," she said. "How will we know the organization is actually getting better at this? And if a project misses, how will we know early enough to do something?" This lesson is about the measures and feedback loops that answer both questions.
Adoption comes before outcomes
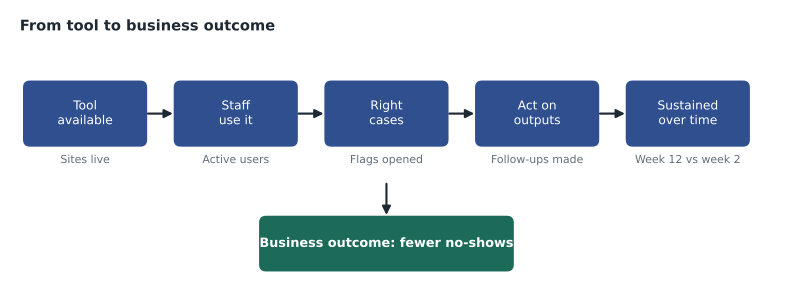
An AI system creates value only when people use it as intended. Between the launch of a tool and the outcome the business case promised sits a chain of behaviour: staff open the tool, use it on the right cases, act on what it tells them, and keep doing so after the novelty wears off. If any link breaks, the outcome does not arrive, however good the model. The exam guide asks you to establish continuous feedback loops and success metrics to track progress and long-term value. Tracking adoption is how a leader sees a broken link before the outcome measures show the damage.
Measures at four levels
Andre organized measures into four levels, from the earliest and easiest to change to the latest and most important. Each level answers a different question.
| Level | Question | Examples for the no-show reminders | How soon it moves |
|---|---|---|---|
| Activity | Is the system running and reaching people? | Bookings scored each day; reminders sent; system availability | Days |
| Adoption | Are people using it as intended? | Share of flagged bookings that reception opens; share followed up by a call or waitlist offer | Weeks |
| Outcome | Is the business result improving? | No-shows per 100 appointments compared with comparison clinics; revenue from kept slots | One to three months |
| Capability | Is the organization getting better at AI? | Time from idea to pilot; initiatives in production with owners; readiness scores; staff confidence | Quarters |
The strategy course warned against vanity metrics, numbers that look good but change no decision. Activity measures are the most likely to become vanity metrics if reported on their own. Reminders sent can rise while no-shows stay flat. They are still useful as operational checks, because a sudden drop in bookings scored usually means a data feed has broken, but they belong in the technical dashboard, not at the top of the board report.
The capability level is the one most programs forget. It tracks the transformation rather than any single tool: whether the second initiative goes from idea to pilot faster than the first, whether the readiness gaps from lesson 2 are closing, whether staff confidence is rising, and whether the share of initiatives with a named owner and monitoring plan stays at 100. Those measures show whether Cascade Ridge is building a lasting ability or just running a series of projects.
An illustrative pilot dashboard
The no-show pilot was planned to start in February 2027 at three clinics, with three similar clinics as a comparison group. To agree the measures in advance, Andre and Noor built an illustrative dashboard showing what week 8 of the pilot might look like. The numbers below are invented for planning, not results. They were chosen to be consistent with the business case in the strategy course: about 14,470 flagged bookings a year across twelve sites is roughly 23 a week per site, so three clinics over eight weeks would flag about 560.
| Measure (pilot clinics, weeks 1 to 8) | Illustrative figure |
|---|---|
| Bookings flagged as likely no-shows | 560 |
| Flagged bookings opened by reception | 532 |
| Flagged bookings followed up with a call or waitlist offer | 322 |
| No-shows expected among flagged bookings without the program | 230 |
| No-shows avoided among flagged bookings | 57 |
Worked problem
Reading the adoption funnel
Using the illustrative dashboard, calculate the open rate, the follow-up rate and the share of expected no-shows avoided. Which link in the chain deserves attention?
Show solution
- Open rate: 532 ÷ 560 = 0.95, so 95 out of every 100 flagged bookings were opened.
- Follow-up rate: 322 ÷ 532 = 0.605, so about 61 out of every 100 opened bookings were followed up.
- Expected no-shows: 560 flagged × 0.41 precision = 229.6, or about 230 likely no-shows among the flagged bookings.
- Avoided: 57 ÷ 230 = 0.248, or about 1 in 4, which matches the recovery rate assumed in the business case.
- Compare the links: opening is nearly complete, but about 39 in 100 opened bookings got no follow-up.
Answer: In this illustration the outcome matches the business case, but the follow-up rate of about 61 in 100 is the weakest link. If follow-ups rose, more no-shows might be avoided. The champions would be asked why some bookings were opened but not followed up: time pressure at the front desk, unclear guidance, or flags that staff did not trust. Each cause has a different fix.
Two cautions came with the dashboard. First, the avoided no-shows can only be estimated by comparing the pilot clinics with the comparison clinics, as the strategy course explained; the 57 is a planning assumption, and the real figure would come from that comparison. Second, eight weeks is short. Noor wanted the gate decision to rest on twelve weeks of data, with the week 8 view used for course correction, not judgement.
Guardrail and fairness measures
Every dashboard also carried guardrail measures, the things that must not get worse while the main measure improves. For the no-show reminders these were complaints about reminders, opt-out requests, flag rates and outcomes by clinic type from lesson 7, and reception overtime. For the call-note summaries they were clinically important omissions in the weekly audit and the edit rate per draft. A pilot that hit its main target while a guardrail moved the wrong way would not pass its gate without an explanation and a fix.
Feedback loops
A feedback loop carries information from the people and systems using AI back to the people who can change it, often enough and quickly enough to matter. The exam guide's phrase, continuous feedback loops, means that this is designed, not left to chance. Cascade Ridge planned loops at several speeds.
| Loop | Speed | From | To | Purpose |
|---|---|---|---|---|
| In-tool feedback | Immediate | Staff using a tool | Initiative team | Flag a wrong or unhelpful output with one click and a short note |
| Champion check-in | Weekly during pilots | Champions | Initiative owner | Report what is working, workarounds and concerns |
| Technical monitoring | Daily to monthly | Monitoring alerts | Technical lead | Catch drift, data problems and failures |
| Pulse survey | Quarterly | All staff | Steering group | Track confidence, worry and trust in AI |
| Portfolio review | Quarterly | All initiatives | Steering group and board | Compare progress, decide scale, continue, pause or stop |
| Client feedback | Ongoing | Clients, through surveys and complaints | Client services manager | Spot confusion or concern about AI-enabled contact |
A loop is only real if something happens when it reports. Noor's rule was that every item of in-tool feedback would be read within a week, and that staff would be told what had changed as a result at least once a month. Nothing kills feedback faster than the sense that nobody reads it. The rule also produced the most useful early signal of all: in the illustrative plan, the volume of feedback would be expected to rise in the first weeks and then fall as problems were fixed. A rise that did not fall would mean problems were not being fixed; a silence from the start would mean people were not using the tool, or not using the feedback button.
Dashboards for different audiences
The strategy course covered communicating value to different audiences. For tracking, the same principle applies: each audience needs a view matched to the decisions it makes. Front-line staff need to see their own clinic's numbers weekly, in simple terms. Site managers need adoption and outcome measures for their clinic compared with others. The steering group needs every initiative's measures, guardrails, costs and risks monthly. The board needs a one-page quarterly view of portfolio value, capability measures and the largest risks.
Cascade Ridge planned to build the manager and steering group views in Amazon Quick from aggregated figures, so that no client-level data appeared on dashboards. The front-line view would be a short weekly message from the champion, because a dashboard that requires logging in is a dashboard that busy reception staff will not see. Definitions would be fixed in writing before the pilot started, so that a measure could not be quietly redefined to look better later.
Long-term value
The exam guide speaks of tracking long-term value, not just pilot results. AI value can fade in several ways. Models drift. Staff drift back to old habits once attention moves elsewhere. Competitors catch up, so an advantage becomes parity. Costs creep as usage grows. And the business changes, so a measure that mattered in 2027 matters less in 2029. A tracking plan for the long term watches for each of these.
- Keep the main outcome measure and its comparison running after scale-up, at least quarterly.
- Re-check adoption a year after launch, when the novelty is gone; it is a better test than the pilot.
- Report each initiative's running cost against its realized value every quarter, as Lorraine had asked.
- Review each initiative's measures every year and retire measures that no longer guide decisions.
- Repeat the readiness scorecard every six months to show whether the organization's capability is growing.
Making measures trustworthy
Measures only help if people trust them. Three practices made Cascade Ridge's numbers harder to argue with. First, every measure had a written definition, a source and an owner: no-shows per 100 appointments meant bookings marked as missed in the practice system, excluding cancellations made more than two hours ahead, counted by the data analyst from the monthly extract. Second, the comparison clinics were chosen before the pilot started, by matching size, client mix and past no-show rates, so that nobody could pick favourable comparisons afterwards. Third, any change to a definition had to be approved by the steering group and noted on the dashboard, with the old and new figures shown side by side for at least one quarter.
These rules can seem pedantic. Their value appears the first time a result disappoints. When a measure has been defined in advance and compared fairly, a disappointing result leads to a useful discussion about why. When it has not, the discussion is about whether the number is right, and the organization learns nothing.
Capability measures in practice
The capability level is harder to measure than the others, but a few simple numbers go a long way. Andre chose four for the board. The time from an idea arriving through the intake form to a decision, which would show whether governance was a bottleneck. The time from approval to the start of a pilot, which should fall as patterns were reused. The share of AI systems in production that had a named owner, a risk tier and a monitoring plan, which should stay at all of them. And the readiness scorecard every six months. None of these measured value directly, but together they showed whether the organization was getting better at the work that produces value.
Tracking questions on the exam
Scenario questions on tracking often describe an initiative with impressive activity numbers but no visible business result, or a pilot judged a success on a few weeks of data. The best answers measure adoption and outcomes rather than activity, compare with a baseline or control group, include guardrails, allow enough time, and set up feedback loops that lead to action. When a scenario describes value fading after a successful launch, look for answers that check adoption, drift and costs, not answers that simply buy a newer model.
Common mistakes
MistakeReporting activity measures as success.
InsteadReport adoption and outcomes; keep activity measures for operational checks.
MistakeJudging a pilot on its first few weeks.
InsteadUse early data for course correction and decide at the planned gate with enough data.
MistakeCollecting feedback without acting on it.
InsteadRead feedback quickly, fix what can be fixed, and tell staff what changed.
MistakeStopping measurement after scale-up.
InsteadKeep outcome, adoption, cost and capability measures running to protect long-term value.
Summary and key terms
- AI value depends on an adoption chain: availability, use, use on the right cases, action on outputs and sustained use.
- Measures sit at four levels: activity, adoption, outcome and capability.
- Activity measures are operational checks, not success measures.
- Adoption measures are leading indicators that show a broken link early.
- Outcome measures need baselines and comparison groups.
- Capability measures track the transformation itself.
- Guardrail and fairness measures must not worsen.
- Feedback loops at several speeds carry information to people who can act, and must visibly lead to change.
- Dashboards should match each audience.
- Long-term tracking watches for drift, habit decay, competitive catch-up, cost creep and changing priorities.
- Adoption chain
- The behaviours between a tool being available and the business outcome.
- Adoption measure
- A measure of whether people use an AI system as intended.
- Capability measure
- A measure of whether the organization is getting better at adopting AI.
- Guardrail measure
- A measure that must not worsen while the main measure improves.
- Feedback loop
- A designed route for information from users and systems back to people who can act.
- Habit decay
- Staff drifting back to old ways of working once attention moves on.
Practice problems
Work each problem on paper first, then reveal the answer to check.
Of 800 flagged bookings, 760 are opened and 456 followed up. What are the open and follow-up rates?
Show answer
Open: 760 ÷ 800 = 0.95, or 95 in 100. Follow-up: 456 ÷ 760 = 0.60, or 60 in 100.
Why is "reminders sent" a poor success measure?
Show answer
It shows activity, not whether no-shows fell; it can rise while the outcome stays flat.
Give one capability measure for an AI transformation.
Show answer
Time from idea to pilot, initiatives in production with owners, readiness scores or staff confidence (any one).
Lesson quiz · 5 questions
Score 60% or more to complete this lesson.
Create a free account to save your progress, take quizzes and earn a certificate.