
ARCH-350 · Lesson 1 of 12 · 23 min
Buildings and climate change
On the first day of the winter term of third year, Professor Tobias Reinholt hangs a single sheet of paper on the studio wall. It shows one number in very large type: 34. 'That is the share of the world's carbon dioxide emissions that comes from building and running buildings,' he says. 'It is more than all the world's cars, trucks, ships and aircraft together. For two and a half years you have learned to make buildings stand up, keep out the weather, hold light and sound, and work as places. This term you will learn to judge them by what they do to the climate, and then to design buildings that do more good than harm.' Wren, Callum, Ingrid and Joon-ho, who have spent the fall in the urban studio, look at the sheet. Joon-ho asks the obvious question: 'Thirty-four per what?' Reinholt smiles. 'That is exactly the right question. Every climate number has a denominator, a boundary and a date. This lesson is about learning to read them.'
The course and the instructor
Reinholt is a sustainability architect. He practised for fifteen years in Vancouver and in Freiburg, Germany, where he designed Passive House schools and led one of the first projects in his firm to pursue the Living Building Challenge. He came to Elmhurst School to teach the course that sits at the centre of the third year: Sustainable and Regenerative Design. It builds on the climate, light and sound of Environmental Systems I, on the embodied carbon lesson of Building Materials and Assemblies, and on the studios, especially the community hub that the students designed in second year and the mixed-use building they finished in December.
The course has three movements. Lessons 1 to 4 deal with carbon: the climate problem, operational energy, embodied carbon and life cycle assessment, and net-zero buildings. Lessons 5 to 8 widen the view to water, materials and health, biophilic design, and resilience in a changing climate. Lessons 9 to 12 look at the tools and ideas that tie these together: rating systems, adaptive reuse, regenerative design and a final sustainability project. That project takes the community hub from second year and asks whether it can become a net-zero carbon building with regenerative goals for its site and its neighbourhood.
The size of the problem
The number on Reinholt's sheet comes from the United Nations Environment Programme's Global Status Report for Buildings and Construction, published in March 2025. It reports that buildings and construction account for about 32% of global energy use and about 34% of global carbon dioxide emissions. The report also found that the sector's emissions had stopped rising in 2024 for the first time since 2020, while floor area kept growing: a sign of progress, but nowhere near the steep decline the climate requires.
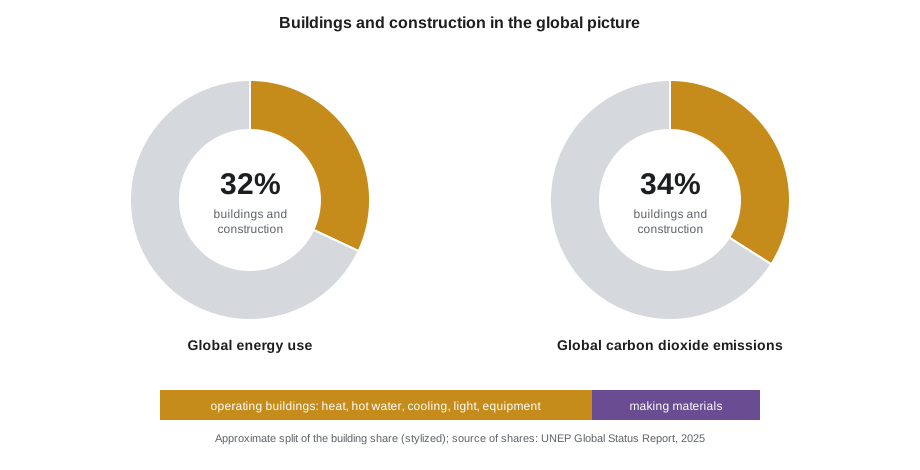
Most of the building share comes from operating buildings: burning gas, oil and coal for heat and hot water, and using electricity, much of it generated from fossil fuels, for lighting, cooling, ventilation and equipment. The rest comes from making construction materials, chiefly cement, steel and aluminum, and from building itself. Cement alone produces several per hundred of the world's carbon dioxide, a fact the students met in Building Materials and Assemblies. As operation becomes cleaner, the share from materials grows, which is why the course gives embodied carbon a whole lesson.
Reinholt asks the students to notice the denominator. The 34 is a share of carbon dioxide from energy and industry, not of all greenhouse gases from all sources, and different reports draw their boundaries differently. Some count only operations; some include materials; some include the methane from gas leaks or the refrigerants that escape from heat pumps and chillers. A sustainability architect has to read every number with its boundary attached, and to state the boundary of every number she quotes.
What the science says
The Intergovernmental Panel on Climate Change (IPCC) assesses the world's climate science every several years. Its Sixth Assessment Report, completed in 2023, concluded that human activity has unequivocally warmed the planet, by about 1.1 °C (2 °F) above pre-industrial levels by the 2010s, and that limiting warming to 1.5 °C (2.7 °F) would require global carbon dioxide emissions to fall by roughly half by 2030 and reach net zero around 2050. The report treated buildings as one of the sectors with the greatest potential for cheap reductions: efficient envelopes, heat pumps, clean electricity, low-carbon materials and, above all, using existing buildings better.
The 2015 Paris Agreement turned that science into a shared goal: to hold warming well below 2 °C (3.6 °F) and pursue efforts toward 1.5 °C (2.7 °F). Countries set their own targets. Canada has committed in law, through the Canadian Net-Zero Emissions Accountability Act of 2021, to net-zero emissions by 2050, with interim targets along the way.
A carbon budget expresses the same idea differently. Because carbon dioxide stays in the atmosphere for centuries, warming depends on the total amount emitted, not the rate in any one year. The world has a remaining budget for each temperature limit, and it is small: at recent rates, the budget for 1.5 °C (2.7 °F) would be used up within a decade or so. Every building the students design will either spend part of that budget or help save it. A building's carbon emitted now, in its materials and construction, matters more than the same carbon emitted in thirty years, because it is spent while the budget is still being decided.
Operational and embodied carbon
The course uses two terms constantly. Operational carbon is the greenhouse gas emitted by running a building: the gas burned in its boiler, the share of the power plant's emissions caused by its electricity, the refrigerant that leaks from its heat pumps. Embodied carbon is the greenhouse gas emitted by making, transporting, installing, maintaining, replacing and finally disposing of its materials. The sum over the building's life is its whole-life carbon.
For most of the twentieth century, architects and engineers paid attention almost only to operational energy, because it was what owners paid for every month. As buildings become more efficient and grids become cleaner, embodied carbon becomes a larger share of the total. In a highly efficient building on a clean grid, the materials may account for most of the carbon the building will ever cause, and most of it is emitted before anyone moves in. Lesson 3 measures this.
The simplest climate calculation in architecture multiplies energy by an emission factor: kilograms of carbon dioxide equivalent per unit of energy. Carbon dioxide equivalent, written CO₂e, converts other greenhouse gases such as methane and refrigerants into the amount of carbon dioxide that would cause the same warming over a hundred years.
Two grids, two answers
The emission factor of electricity depends on how the grid generates it, and here Winnipeg and Minneapolis differ dramatically. Manitoba's electricity comes almost entirely from hydroelectric dams on the Nelson, Winnipeg and Saskatchewan rivers. Manitoba Hydro reports emissions at generation of well under 1 gram of CO₂e per kilowatt-hour: 0.44 tonnes per gigawatt-hour in 2020. Natural gas, by contrast, emits about 1.96 kg of CO₂e per cubic metre burned.
Reinholt asks the students to compare two ordinary detached houses in their own city, one heated by a gas furnace and one by an electric heat pump, each with the same electricity use for lights and appliances.
# Annual operational emissions of two houses
# Emission factors: electricity from Manitoba Hydro (at generation, 2020); natural gas per cubic metre
EF_ELEC = 0.00044      # kg CO2e per kWh
EF_GAS = 1.96       # kg CO2e per m3 of gas

base_kwh = 9000      # lights, appliances and fans, kWh per year (same in both houses)
gas_use = 2200      # m3 of gas per year for the furnace and water heater
hp_kwh = 15000       # extra kWh per year for a heat pump and heat pump water heater

gas_house = base_kwh * EF_ELEC + gas_use * EF_GAS
hp_house = (base_kwh + hp_kwh) * EF_ELEC
print(f"gas furnace house: {gas_house:8.0f} kg CO2e per year")
print(f"heat pump house:   {hp_house:8.0f} kg CO2e per year")
print(f"gas house minus heat pump house: {gas_house - hp_house:8.0f} kg CO2e per year")
# How clean must the grid become before the heat pump house emits half as much as the gas house?
half = 0.5 * gas_house
print(f"grid factor for heat pump house at half the gas house: {half / (base_kwh + hp_kwh):.3f} kg CO2e per kWh")gas furnace house: 4316 kg CO2e per year heat pump house: 11 kg CO2e per year gas house minus heat pump house: 4305 kg CO2e per year grid factor for heat pump house at half the gas house: 0.090 kg CO2e per kWh
In Winnipeg, the gas house emits about 4.3 tonnes of CO₂e a year and the heat pump house only about 11 kilograms: switching saves almost everything. The electricity for lights and appliances hardly matters, and saving it has almost no local climate effect.
The lesson the students draw is not that one city is virtuous and the other is not. It is that the same building can have very different carbon results depending on where it stands and when it runs, and that a design must be judged with the right emission factors, including how they will change over the building's life. Electrifying a building on a grid that is becoming carbon-free locks in steadily falling emissions; burning gas locks in emissions for as long as the boiler lasts.
There is a further subtlety. Manitoba exports a large share of its hydroelectricity to neighbouring provinces and states, where it displaces power from gas and coal plants. Manitoba Hydro also publishes a regional factor of about 750 g per kWh to represent that effect. A kilowatt-hour saved in Winnipeg can therefore reduce emissions elsewhere, which is one reason efficiency still matters on a clean grid. The students will meet the distinction between average and marginal factors again in Lesson 2.
Mitigation and adaptation
Architects respond to climate change in two ways. Mitigation reduces the emissions that cause it: efficient buildings, clean energy, low-carbon materials, reuse. Adaptation prepares buildings and communities for the climate that is already arriving: hotter summers, heavier rain, longer droughts, more frequent wildfire smoke. The Prairies and the upper Midwest have warmed faster than the global average, especially in winter. In May 2025, wildfires forced the evacuation of Flin Flon and other northern Manitoba communities, and the province declared a state of emergency, while smoke drifted over Winnipeg for days. A sustainable building must both cut its emissions and keep people safe and well in the climate it will actually face. Lesson 8 deals with adaptation in detail.
Beyond less bad
Reinholt ends the first session with a distinction that runs through the whole course. Most green building has aimed to be less bad: less energy, less carbon, less water, less waste than an ordinary building. That is necessary, but a building that is only less bad still does harm. Regenerative design, the subject of Lesson 11, asks whether buildings can do net good: produce more energy than they use, clean more water than they dirty, increase the life on their sites, and strengthen the communities around them. 'You will not reach that goal in one term,' he says. 'But you should know where the road is going before you take the first step.'
Worked problem
Reading a climate claim
A product brochure says: 'Our wall panel cuts building emissions by 40%.' Joon-ho is asked to evaluate the claim. What questions should he ask?
Show solution
- Ask for the denominator: 40% of what? Of the whole building's emissions, of its heating energy, or of the wall's own embodied carbon?
- Ask for the boundary: does the figure include only operation, or also the panel's manufacture and disposal (life cycle stages A to C)?
- Ask for the baseline: compared with which wall, built to which code?
- Ask for the location and grid: an energy saving produces very different carbon savings on Manitoba's hydro grid and on a coal-heavy grid.
- Ask for the period: over one year, over sixty years, with the grid changing?
- Ask for evidence: an environmental product declaration (EPD) and an energy model or measured data, not a marketing estimate.
Answer: A climate claim without its denominator, boundary, baseline, location and period cannot be judged. Joon-ho writes to the manufacturer and learns that the 40% referred to heat loss through that wall alone, compared with an old uninsulated wall, which is a very different claim.
Exercise 1: carbon portrait of a building
Each student chooses a building they know well, their family home, an apartment block or a school, and prepares a one-page carbon portrait.
- Collect a year of energy bills or estimate energy use from floor area and type.
- Convert energy to emissions with local emission factors, stating their source and year.
- Estimate the building's main materials and note which are likely to carry most of the embodied carbon.
- Identify the three most effective changes that would reduce its emissions, and explain why.
- State the boundary, baseline and period of every number you give.
Self-critique checklist
- Have I stated the denominator and boundary of every climate number?
- Have I used emission factors for the right place and year?
- Have I thought about how those factors will change over the building's life?
- Have I considered both operational and embodied carbon?
Common mistakes
MistakeQuoting a share without its denominator.
InsteadSay what it is a share of: energy, carbon dioxide, all greenhouse gases, operations only or whole life.
MistakeUsing one emission factor for every location.
InsteadUse the factor for the building's grid and fuel, and say where it comes from.
MistakeAssuming the grid will stay as it is.
InsteadConsider how the grid will change over the building's life, especially where laws require it to decarbonize.
MistakeIgnoring materials because they are not on the energy bill.
InsteadCount embodied carbon, which is emitted before the building opens.
MistakeTreating adaptation as separate from mitigation.
InsteadDesign buildings that both cut emissions and stay safe in the coming climate.
Summary and key terms
- Buildings and construction use about 32% of the world's energy and produce about 34% of its carbon dioxide emissions.
- Limiting warming requires global emissions to fall steeply this decade and reach net zero around mid-century; the remaining carbon budget is small.
- Operational carbon comes from running a building; embodied carbon comes from its materials and construction; together they make whole-life carbon.
- Emissions equal energy times an emission factor, and factors differ enormously between grids such as Manitoba's hydro grid and Minnesota's mixed grid.
- Architects must mitigate emissions, adapt buildings to the coming climate, and aim beyond less bad toward regenerative design.
- Operational carbon
- Greenhouse gas emitted by running a building: fuel, electricity and refrigerant leaks.
- Embodied carbon
- Greenhouse gas emitted by making, transporting, installing, replacing and disposing of materials.
- Whole-life carbon
- The sum of operational and embodied carbon over a building's life.
- CO2e
- Carbon dioxide equivalent: other greenhouse gases converted to the amount of carbon dioxide with the same warming effect.
- Emission factor
- Mass of greenhouse gas emitted per unit of energy, such as kilograms of CO₂e per kilowatt-hour.
- Carbon budget
- The total remaining emissions compatible with a given limit on warming.
- Mitigation
- Action that reduces the emissions causing climate change.
- Adaptation
- Action that prepares buildings and communities for climate impacts.
Practice problems
Work each problem on paper first, then reveal the answer to check.
A building uses 120,000 kWh of electricity a year on a grid with a factor of 0.002 kg CO₂e per kWh. What are its annual operational emissions?
Show answer
120,000 × 0.002 = 240 kg CO₂e.
Why does embodied carbon become a larger share of whole-life carbon as buildings improve?
Show answer
As envelopes become efficient and grids clean, operational emissions fall, so the fixed emissions from materials make up more of the total.
A boiler burns 10,000 m³ of gas a year at 1.96 kg CO₂e per m³. What does it emit?
Show answer
19,600 kg, or about 19.6 tonnes of CO₂e.
Why does carbon emitted now matter more than the same carbon emitted in thirty years?
Show answer
Warming depends on cumulative emissions and the remaining budget is small; early emissions use up the budget while it is still being decided, and they stay in the atmosphere for centuries.
Name one example each of mitigation and adaptation in building design.
Show answer
Mitigation: a heat pump replacing a gas boiler, or a low-carbon concrete mix. Adaptation: shading and passive cooling for heat waves, filtered ventilation for wildfire smoke, or raised floors in a flood zone.
Lesson quiz · 5 questions
Score 60% or more to complete this lesson.
Create a free account to save your progress, take quizzes and earn a certificate.