
AI-110 · Lesson 8 of 12 · 29 min
Statistics for data analysis
Plots (Lesson 7) show patterns; statistics say how confident we can be in them. This lesson is a practical tour of the statistical tools an AI practitioner uses most: summarizing distributions, confidence intervals, comparing groups with t-tests, comparing proportions in A/B tests, the trap of Simpson's paradox, and fitting and interpreting a simple regression. Lesson 4 built intuition with simulation; here we use the classical formulas through SciPy, which are fast and standard, and keep asking the same questions: how big is the effect, how uncertain is it, and could something other than the obvious explanation be responsible?
Describing a distribution
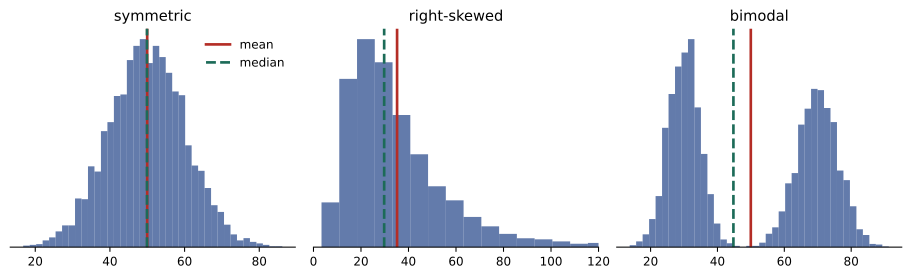
A distribution is summarized by its centre (mean, median), its spread (standard deviation, interquartile range, percentiles) and its shape (symmetric, skewed, multimodal). The right summary depends on the shape and on the decision being made. For power planning, the 95th percentile of server power often matters more than the mean; for skewed quantities such as costs or repair times, the median is more typical than the mean (Lesson 4).
import numpy as np
import pandas as pd

rng = np.random.default_rng(21)
watts = pd.DataFrame({
    "server": np.repeat(["cpu", "gpu"], [120, 40]),
    "watts": np.concatenate([rng.normal(420, 45, 120), rng.lognormal(np.log(2900), 0.18, 40)]).round(0),
})
print(watts.groupby("server")["watts"].describe(percentiles=[0.5, 0.95]).round(0).to_string())
print("Skewness:", watts.groupby("server")["watts"].skew().round(2).to_dict()) count mean std min 50% 95% max
server
cpu 120.0 420.0 42.0 288.0 418.0 484.0 518.0
gpu 40.0 2831.0 484.0 2008.0 2688.0 3690.0 3807.0
Skewness: {'cpu': -0.2, 'gpu': 0.35}Summarizing by group is essential when the data mixes populations. A single mean over all 160 servers, about 1,000 W, would describe neither kind of server: CPU servers draw about 420 W and GPU servers about 2,800 W. Skewness measures asymmetry: positive values mean a longer right tail, as with the GPU servers, whose occasional heavy workloads push the maximum well above the median.
Confidence intervals for a mean
The sample mean \(\bar{x}\) of \(n\) values estimates the population mean with standard error \(s/\sqrt{n}\). For small samples from roughly normal data, a 95% confidence interval uses the t distribution with \(n-1\) degrees of freedom:
The multiplier \(t_{0.975,\,n-1}\) is about 2.2 for 12 values and approaches 1.96 for large samples. The interpretation is subtle: if we repeated the study many times, 95% of intervals built this way would contain the true mean. In practice, a narrow interval means a precise estimate, and a wide one is a warning that more data is needed before drawing firm conclusions.
Comparing two groups: the t-test
Two sites report weekly PUE (power usage effectiveness, total facility power divided by IT power). Site B looks better. Is the difference real, and how big is it?
import numpy as np
from scipy import stats

rng = np.random.default_rng(4)
a = rng.normal(1.42, 0.06, 12)     # weekly PUE at site A
b = rng.normal(1.36, 0.05, 10)     # weekly PUE at site B

for name, x in [("A", a), ("B", b)]:
    lo, hi = stats.t.interval(0.95, len(x) - 1, loc=x.mean(), scale=stats.sem(x))
    print(f"Site {name}: mean {x.mean():.3f}, 95% CI {lo:.3f} to {hi:.3f}")

t, p = stats.ttest_ind(a, b, equal_var=False)       # Welch t-test
diff = a.mean() - b.mean()
pooled_sd = np.sqrt((a.var(ddof=1) + b.var(ddof=1)) / 2)
print(f"Difference {diff:.3f}, t = {t:.2f}, p = {p:.4f}, effect size d = {diff / pooled_sd:.2f}")Site A: mean 1.419, 95% CI 1.379 to 1.459 Site B: mean 1.351, 95% CI 1.307 to 1.396 Difference 0.068, t = 2.54, p = 0.0198, effect size d = 1.09
The Welch t-test compares two means without assuming the groups have equal variances, which is the safer default. Here \(p \approx 0.02\): if the two sites really had the same mean PUE, a difference this large would arise by chance only about 2% of the time. The effect size, Cohen's \(d\), expresses the difference in standard deviations; \(d \approx 1.1\) is large.
Statistical significance is not the same as importance. With thousands of observations, a trivial difference of 0.001 in PUE would be "significant"; with a handful, an important difference might not be. Always report the size of the difference with its confidence interval, and judge it against what matters in practice. A PUE difference of 0.068 at a 20 MW site is worth about 1.4 MW of facility power.
Worked problem
What the difference is worth
Site A runs 20 MW of IT load with a PUE of 1.419; site B's design achieves 1.351. If site A could match site B, how much energy and money would it save per year at $0.09 per kWh?
Show solution
- Facility power at A: \(20 \times 1.419 = 28.38\) MW; at B's PUE: \(20 \times 1.351 = 27.02\) MW.
- Saving: \(1.36\) MW.
- Energy: \(1.36 \times 8{,}760 = 11{,}914\) MWh per year.
- Cost: \(11{,}914{,}000 \times 0.09 = \$1.07\) million per year.
Answer: About 1.36 MW, 11.9 GWh and $1.07 million a year. Even so, the comparison is observational: the sites differ in climate, age and equipment, so the analysis says the sites differ, not why, and not that copying B's design would achieve the same result at A.
Comparing proportions: A/B tests
Many AI products are evaluated with A/B tests: users are randomly assigned to the old version (A) or the new one (B), and an outcome such as clicks, purchases or problems resolved is compared. Random assignment is what makes the comparison fair: it balances every other factor, known or unknown, between the groups, so a difference can be attributed to the change.
import numpy as np
from scipy import stats

#                 resolved by bot, escalated
table = np.array([[1840, 1160],     # old help-desk assistant
                  [1972, 1028]])    # new assistant
rates = table[:, 0] / table.sum(axis=1)
print("Resolution rates:", np.round(rates, 3))

chi2, p, dof, expected = stats.chi2_contingency(table, correction=False)
print(f"chi-square = {chi2:.2f}, p = {p:.5f}")

n1, n2 = table.sum(axis=1)
diff = rates[1] - rates[0]
se = np.sqrt(rates[0] * (1 - rates[0]) / n1 + rates[1] * (1 - rates[1]) / n2)
print(f"Improvement {diff:.3f}, 95% CI {diff - 1.96 * se:.3f} to {diff + 1.96 * se:.3f}")Resolution rates: [0.613 0.657] chi-square = 12.53, p = 0.00040 Improvement 0.044, 95% CI 0.020 to 0.068
The new assistant resolved 65.7% of 3,000 requests against 61.3% for the old one. The chi-square test gives \(p = 0.0004\), so chance is a very unlikely explanation, and the 95% confidence interval says the true improvement is probably between 2.0 and 6.8 percentage points. The standard error of a difference in proportions is
Worked problem
How big must an A/B test be?
A team expects a new model to raise a resolution rate from 60% to 62%. Roughly, how many requests per group are needed for the 95% confidence interval of the difference to be no wider than ±1 percentage point?
Show solution
- Require \(1.96 \times SE \le 0.01\), so \(SE \le 0.0051\).
- With \(p \approx 0.61\) in both groups and equal sizes \(n\): \(SE \approx \sqrt{2 \times 0.61 \times 0.39 / n}\).
- Solve: \(n \ge 2 \times 0.2379 / 0.0051^{2} = 0.4758/0.000026 = 18{,}300\).
Answer: About 18,000 requests per group. Small improvements need large tests, which is why teams decide the sample size before starting rather than stopping as soon as the result looks good. Stopping early when p dips below 0.05 ("peeking") greatly increases false positives.
Simpson's paradox
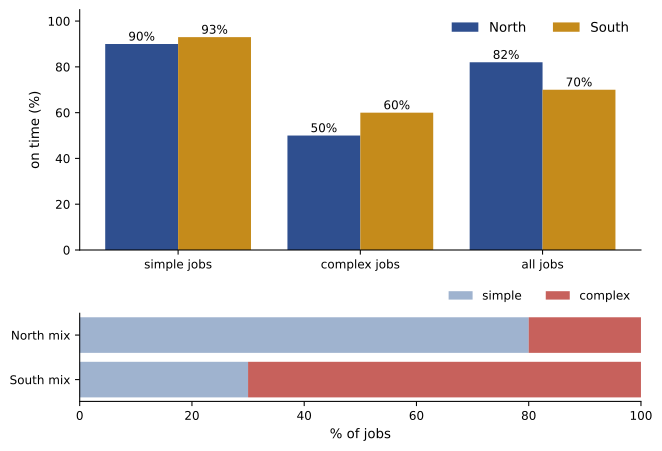
Aggregated data can point the opposite way from every one of its parts. Two maintenance teams handle simple and complex jobs. Which team is better at finishing on time?
import pandas as pd

jobs = pd.DataFrame({
    "team":   ["North"] * 2 + ["South"] * 2,
    "kind":   ["simple", "complex", "simple", "complex"],
    "jobs":   [80, 20, 30, 70],
    "on_time": [72, 10, 28, 42],
})
jobs["rate"] = jobs["on_time"] / jobs["jobs"]
print(jobs.pivot(index="kind", columns="team", values="rate").round(2).to_string())

overall = jobs.groupby("team")[["on_time", "jobs"]].sum()
print((overall["on_time"] / overall["jobs"]).round(2).to_string())team North South kind complex 0.5 0.60 simple 0.9 0.93 team North 0.82 South 0.70
South is better at both simple jobs (93% against 90%) and complex jobs (60% against 50%), yet North looks better overall (82% against 70%). The reason is the mix: 70% of South's jobs are complex, against 20% of North's, and complex jobs are late more often for everyone. Comparing the overall rates confounds team skill with job mix. This is Simpson's paradox, and it appears in medicine, admissions data, model evaluation and any comparison where groups differ in composition. The remedy is to compare like with like: stratify by the confounding variable, or adjust for it in a model, and above all think about what else differs between the groups.
Correlation and simple regression
Correlation measures how closely two variables follow a straight-line relationship, from −1 to +1 (Lesson 7). Regression goes further and fits a line \(y = a + bx\) by least squares, so that the slope \(b\) estimates how much \(y\) changes per unit of \(x\). The coefficient of determination \(R^{2}\) is the fraction of the variation in \(y\) that the line explains.
import numpy as np
from scipy import stats

rng = np.random.default_rng(12)
outside = rng.uniform(-15, 32, 60)                       # daily mean outdoor temperature, C
pue = 1.18 + 0.0062 * np.clip(outside, 5, None) + rng.normal(0, 0.012, 60)

fit = stats.linregress(outside, pue)
print(f"PUE = {fit.intercept:.3f} + {fit.slope:.4f} x temperature,  R^2 = {fit.rvalue**2:.2f}")

warm = outside >= 5
fit_warm = stats.linregress(outside[warm], pue[warm])
print(f"Warm days only: slope {fit_warm.slope:.4f} per C, R^2 = {fit_warm.rvalue**2:.2f}")
print("Mean PUE below 5 C:", round(pue[~warm].mean(), 3))PUE = 1.229 + 0.0039 x temperature, R^2 = 0.88 Warm days only: slope 0.0059 per C, R^2 = 0.95 Mean PUE below 5 C: 1.21
The fit over all days explains 88% of the variation, but the relationship is not really a straight line: below about 5 °C the site runs on free cooling and PUE stays flat, and above it PUE rises steeply. Fitting one line averages the two regimes and understates the warm-weather slope (0.0039 against 0.0059 per °C). Always plot the data and the residuals (the differences between the data and the fitted line) before trusting a fit; a curve, a kink or a fan-shaped spread in the residuals means the model is missing something.
Regression describes association, not causation. Outdoor temperature plausibly causes PUE changes through physics, but in other data, such as the relationship between the number of monitoring alerts and the number of outages, a third factor (a large, old, busy site) might drive both. Causal claims need either a controlled experiment, such as an A/B test, or careful reasoning about confounders.
Worked problem
Using the warm-weather slope
Using the warm-day fit (slope 0.0059 per °C), estimate how much PUE rises if the average summer temperature at the site increases by 2 °C, and what that means for a 10 MW IT load.
Show solution
- PUE rise: \(2 \times 0.0059 = 0.0118\).
- Extra facility power: \(10 \times 0.0118 = 0.118\) MW = 118 kW.
Answer: PUE rises by about 0.012, adding about 118 kW of facility power during warm weather. The estimate is reliable only within the range of temperatures in the data; extrapolating to much hotter conditions, where chillers may reach their limits, would be guesswork.
A checklist for statistical claims
- What is the estimate, and what is its confidence interval?
- Is the effect large enough to matter in practice?
- How were the groups formed? Were they randomized? What else differs between them?
- How many comparisons were made before this one was reported (Lesson 4)?
- Do the data meet the method's assumptions (independence, roughly normal means, a straight-line relationship)? If not, use the bootstrap, a permutation test or a better model.
- Has the result been checked on new data?
Common mistakes
MistakeSummarizing mixed or skewed data with one mean.
InsteadSummarize by group and use medians and percentiles where they fit better.
MistakeEquating statistical significance with practical importance.
InsteadReport the effect size and confidence interval and judge them against what matters.
MistakeStopping an A/B test as soon as p < 0.05.
InsteadFix the sample size in advance.
MistakeComparing aggregate rates of groups with different mixes.
InsteadStratify by the confounding variable to avoid Simpson's paradox.
MistakeFitting a straight line without looking at the data and residuals.
InsteadPlot first; look for curves, kinks and changing spread.
Summary and key terms
- Summaries describe centre, spread and shape; choose them to suit the data and decision.
- Confidence intervals express the uncertainty of an estimate; t intervals suit small samples.
- The Welch t-test compares two means; report effect sizes, not just p-values.
- A/B tests use random assignment; the chi-square test and a CI compare proportions.
- Simpson's paradox: aggregate comparisons can reverse when group mixes differ.
- Regression estimates slopes and R²; check residuals and avoid extrapolation.
- Association is not causation without randomization or careful reasoning.
- Skewness
- A measure of a distribution's asymmetry.
- t distribution
- The distribution used for intervals and tests of means from small samples.
- Welch t-test
- A test comparing two means without assuming equal variances.
- Effect size
- The size of a difference, often in standard deviations (Cohen's d).
- A/B test
- A randomized experiment comparing two versions.
- Chi-square test
- A test of association between categorical variables.
- Simpson's paradox
- A trend that appears in groups but reverses when they are combined.
- Confounder
- A variable that influences both the supposed cause and the effect.
- Least squares
- Fitting a line by minimizing the sum of squared residuals.
- R²
- The fraction of the variation in the outcome explained by a model.
Practice problems
Work each problem on paper first, then reveal the answer to check.
Which is more typical for skewed repair costs, the mean or the median?
Show answer
The median.
Sample of 25, mean 50, s = 10. Standard error?
Show answer
2.
Approximate 95% CI for that mean (t ≈ 2.06)?
Show answer
45.9 to 54.1.
What does p = 0.02 mean in a two-group comparison?
Show answer
If there were no real difference, a difference this large would occur by chance about 2% of the time.
Two groups differ by 3 units with a pooled SD of 6. Cohen's d?
Show answer
0.5.
Why randomize assignment in an A/B test?
Show answer
To balance all other factors between groups so the difference can be attributed to the change.
Rates 0.50 and 0.55 with 1,000 per group. SE of the difference?
Show answer
√(0.25/1000 + 0.2475/1000) ≈ 0.0223.
What causes Simpson's paradox?
Show answer
Groups with different mixes of a confounding variable.
A fit has R² = 0.64. What fraction of variation is unexplained?
Show answer
36%.
Slope 0.004 PUE per °C. PUE change for +5 °C?
Show answer
+0.02.
Lesson quiz · 5 questions
Score 60% or more to complete this lesson.
Create a free account to save your progress, take quizzes and earn a certificate.