
AI-110 · Lesson 11 of 12 · 32 min
Reproducible notebooks and projects
A result that cannot be reproduced cannot be trusted. If a model reached 94% accuracy last month but nobody can rerun the work and get 94% again, it is impossible to tell whether a new idea is an improvement, whether a bug crept in, or whether the original number was ever right. Surveys of researchers in many fields have found that a large share have failed to reproduce someone else's results, and many have failed to reproduce their own. Machine learning is especially vulnerable, because results depend on data versions, random seeds, library versions and long chains of preprocessing steps.
Reproducibility is not a matter of heroic effort at the end of a project. It comes from a set of small habits practised from the start: running notebooks cleanly, controlling randomness, recording environments and data versions, organizing code into projects, using version control and writing simple tests. This chapter covers each of them. Together they turn an analysis from something that worked once on one laptop into something a colleague, a reviewer or you, six months from now, can run again and believe.
Notebooks: power and pitfalls
Jupyter notebooks are the natural home for exploration. Each cell can be run, edited and rerun while the data stays loaded in memory, plots appear inline, and explanatory text sits beside the code. That interactivity is also their main danger.
Hidden state
A notebook's kernel (the running Python process) remembers every variable from every cell that has run, in the order they ran, not the order they appear on the page. Cells can be run out of order, edited after running, or deleted after creating variables that other cells still use. The notebook on screen then no longer describes the computation that produced its outputs. This is called hidden state, and it is the most common reason a notebook "worked yesterday" but fails or gives different numbers when someone else runs it.
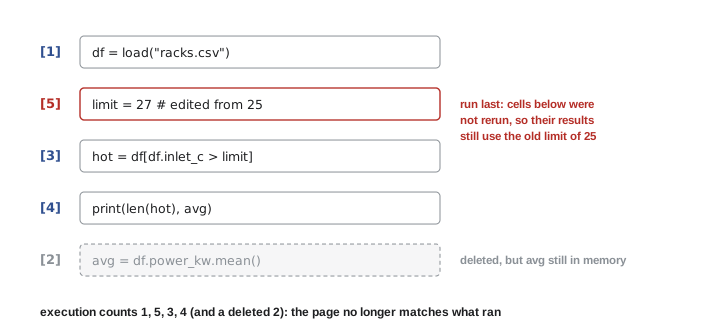
Three habits prevent it:
- Restart and run all. Before trusting or sharing a result, restart the kernel and run every cell from top to bottom. If it fails or gives different results, the notebook had hidden state. Execution counts in square brackets beside each cell should then read 1, 2, 3 in order.
- Keep notebooks linear. Write cells so they make sense run top to bottom, load data at the top, and avoid cells that modify data loaded in earlier cells in place, so that rerunning a cell does not apply a change twice.
- Move reusable code out of notebooks. When a function proves useful, put it in a .py module in the project and import it. Notebooks are for exploring and presenting; modules are for code that other code depends on.
Other notebook habits
Notebooks store their outputs inside the file, including plots and sometimes large tables, which makes them big and hard to compare in version control. Clearing outputs before committing (or using tools such as nbstripout or Jupytext, which pairs a notebook with a plain .py file) keeps the history readable. Give notebooks descriptive names with a number prefix that shows their order (01_load_and_clean.ipynb, 02_explore.ipynb, 03_baseline_model.ipynb), and put a short markdown cell at the top saying what the notebook does, what data it uses and what it produces.
Controlling randomness
Machine learning is full of random choices: how data is shuffled and split into training and test sets, how model weights are initialized, which examples form each training batch, and how data is augmented. Rerunning with different random choices gives slightly different results. That variation is real and worth knowing about, but it must be controlled, or every comparison between experiments is muddied by noise.
The tool is the random seed (Lesson 3). Creating a generator from a fixed seed makes the sequence of random numbers, and so the whole computation, repeatable.
import numpy as np

def split(n, test_frac, seed):
    """Shuffle row numbers 0..n-1 and split them into train and test sets."""
    rng = np.random.default_rng(seed)
    idx = rng.permutation(n)
    k = int(n * test_frac)
    return idx[k:], idx[:k]

train1, test1 = split(10, 0.3, seed=42)
train2, test2 = split(10, 0.3, seed=42)
_, test3 = split(10, 0.3, seed=7)
print(test1, test2, test3)
print(np.array_equal(test1, test2), np.array_equal(test1, test3))[5 6 0] [5 6 0] [8 0 7] True False
Good practice is to pass seeds explicitly, as this function does, rather than relying on a global random state that any other code might disturb. Record the seed with the results. Machine learning libraries have their own random number generators (scikit-learn takes a random_state argument; PyTorch has torch.manual_seed), and each must be seeded. Some GPU operations are not perfectly deterministic even with fixed seeds, because the order of parallel floating-point additions can vary; frameworks offer deterministic modes at some cost in speed.
Seeds are for repeatability, not for choosing a lucky result. A responsible comparison runs each experiment with several different seeds and reports the average and the spread. If a new method beats the old one by 0.3 percentage points but different seeds move the result by 1 point, the difference is noise.
Worked problem
Is the improvement real?
A baseline model and a new model are each trained with five different seeds. Baseline accuracies: 91.2, 90.6, 91.8, 90.9, 91.5%. New model: 91.9, 91.1, 92.3, 91.4, 91.8%. With seed 42 alone, the new model scored 92.3% against the baseline's 90.6%. What should be reported?
Show solution
- Baseline mean: \((91.2 + 90.6 + 91.8 + 90.9 + 91.5)/5 = 91.2\%\). Range 90.6 to 91.8.
- New model mean: \((91.9 + 91.1 + 92.3 + 91.4 + 91.8)/5 = 91.7\%\). Range 91.1 to 92.3.
- Mean improvement: 0.5 percentage points, while each model varies by about 1.2 points across seeds.
- The single-seed comparison (92.3 vs 90.6, a 1.7-point gain) happened to pair the new model's best run with the baseline's worst.
Answer: Report about 91.2% versus 91.7%, a 0.5-point mean improvement, with the spread across seeds. The gain is plausible but small relative to seed-to-seed variation; more seeds or a statistical test would be needed to be confident. The 1.7-point single-seed figure overstates it.
Recording the environment
Lesson 1 introduced environments and requirements files. For reproducibility, every result should be traceable to the exact software that produced it. Pin versions in a lock file (pip freeze > requirements.txt, conda env export, or the lock file of a tool such as uv or Poetry), commit it with the code, and print key versions at the top of notebooks so that the record travels with the output.
import platform
import sys
import numpy as np
import pandas as pd

print("Python", sys.version.split()[0], "on", platform.system())
print("numpy", np.__version__, "| pandas", pd.__version__)Python 3.13.16 on Linux numpy 2.5.3 | pandas 3.0.5
Your output will show your own versions. For complete isolation, including the operating system and system libraries, teams package environments as containers (Docker images). A container image built from a recorded recipe runs identically on a laptop, a server and a cloud cluster, which is how most production machine learning systems are deployed.
Versioning data
Code changes are easy to track; data changes are often invisible. A colleague re-exports a table with a corrected column, a pipeline starts dropping rows after an upstream change, or a file is overwritten with a newer extract under the same name. The code is identical, but the results move. Reproducibility therefore requires knowing exactly which data was used.
Simple measures go a long way. Treat raw data as read-only: never edit it by hand, and keep it separate from processed data, which code regenerates. Name data extracts with dates or version numbers. And record a fingerprint of each data file: a cryptographic hash such as SHA-256 is a short string that changes completely if even one byte of the file changes.
import hashlib

data = b"rack,power_kw\nA01,11.8\nA02,12.6\n"
print(hashlib.sha256(data).hexdigest()[:16])
changed = data.replace(b"12.6", b"12.7")       # one digit edited
print(hashlib.sha256(changed).hexdigest()[:16])6653ee4b2b6fd491 b5a4efd579329d00
Storing the hash of each input file alongside a result (in a log, a results table or the notebook output) lets anyone check later that they are using the same data. For larger projects, tools such as DVC (Data Version Control) and data lake table formats track data versions alongside code, and model registries such as MLflow record which data, code, parameters and environment produced each trained model.
Organizing a project
A consistent folder layout makes a project understandable at a glance and separates things that change for different reasons. A widely used layout, adapted from templates such as Cookiecutter Data Science, looks like this:
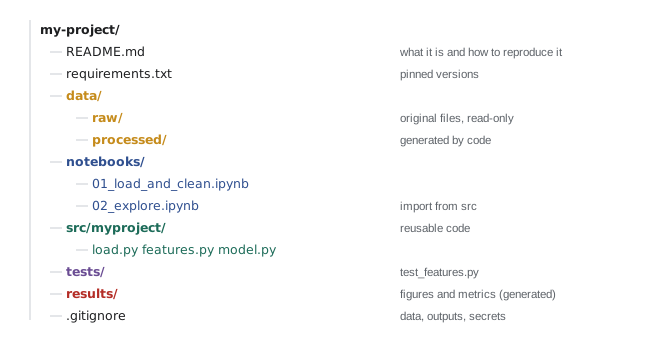
- README.md explains what the project is, how to set up the environment and how to reproduce the main results, step by step.
- data/raw holds original data, never modified; data/processed holds files that code generates and can regenerate.
- src/ (or a folder named after the project) holds reusable code as an importable package: loading, cleaning, features, models.
- notebooks/ holds numbered exploratory and reporting notebooks that import from src.
- tests/ holds automated tests for the code in src.
- results/ (or reports/) holds generated figures, tables and metrics.
Paths inside code should be relative to the project root, built with pathlib (Path("data") / "raw" / "racks.csv"), never absolute paths like C:/Users/alex/Desktop/final_v2.csv that exist on only one computer. Settings that change between experiments (file names, thresholds, model parameters, seeds) belong in a configuration file or function arguments, not scattered through the code as magic numbers.
Version control with Git
Git records the history of a project as a series of commits, each a snapshot with a message describing what changed and why. With Git you can see exactly what code produced a result (by recording the commit identifier with it), return to any earlier version, work on experiments in separate branches without disturbing working code, and collaborate through platforms such as GitHub and GitLab, where teammates review each other's changes.
Commit small, coherent changes with clear messages ("Fill missing power readings by interpolation" rather than "updates"). Do not commit large data files, secrets such as passwords and API keys, or generated outputs; list them in a .gitignore file. Secrets belong in environment variables or a secrets manager, because anything committed to a repository should be assumed to be visible to everyone who can see the repository, including its history.
Testing data code
Bugs in data code rarely crash a program. They produce numbers that are slightly wrong, and nobody notices. Automated tests are small functions that check that code does what it should; running them after every change catches mistakes early. The convention, used by the pytest tool, is to write functions whose names start with test_ in files whose names start with test_, using assert statements that fail loudly when something is wrong.
def pue(facility_kwh, it_kwh):
    """Power usage effectiveness: facility energy divided by IT energy."""
    if it_kwh <= 0:
        raise ValueError("IT energy must be positive")
    return facility_kwh / it_kwh

def test_pue():
    assert pue(150, 100) == 1.5
    assert abs(pue(1, 3) - 0.3333) < 1e-3
    try:
        pue(100, 0)
    except ValueError:
        pass
    else:
        raise AssertionError("expected a ValueError for zero IT energy")

test_pue()
print("all tests passed")all tests passed
With pytest installed, saving the test in tests/test_metrics.py and running pytest in the project folder finds and runs every test automatically, reporting any that fail. Good tests for data work check known answers on tiny examples (like the PUE of 150 over 100), edge cases (zero, empty tables, missing values) and expectations about data itself: that a key column has no duplicates, that power is never negative, that a merge did not lose rows. Checks of the last kind can also run inside the pipeline on real data, stopping it when data arrives in an unexpected form.
Worked problem
Making a project reproducible
A teammate hands over a folder containing analysis_final_v3.ipynb (cells numbered 14, 3, 27, 9), a file data.csv that was edited by hand to fix some values, and no other files. The notebook trains a model and reports 88% accuracy. List the steps to make the work reproducible.
Show solution
- Create an environment, install what the notebook imports, and record versions in a pinned requirements file.
- Restart the kernel and run all cells in order; fix any cell that fails or depends on deleted variables. Check whether 88% is reproduced.
- Recover the original raw data if possible, store it read-only in data/raw, and turn the manual fixes into documented cleaning code that writes data/processed.
- Fix the random seeds for the split and model; run with several seeds and report the mean and spread.
- Move reusable functions into src/, add tests for the cleaning code, and write a README with setup and run instructions.
- Put the project under Git, record the commit and data hashes with the reported results.
Answer: Environment, clean top-to-bottom run, raw data plus scripted cleaning, controlled seeds with several runs, modules and tests, README, and version control. The accuracy may change once hidden state and manual edits are removed, and the reproducible number is the one to report.
From notebook to pipeline
As a project matures, the sequence of notebooks becomes a pipeline: scripts or functions that run in order from raw data to results with a single command. Simple pipelines are a Makefile or a short Python script that calls each step; larger ones use workflow tools that track which steps need rerunning when inputs change. The goal is that anyone can type one command, such as python -m project.run_all, and regenerate every figure and number in the final report. When that is true, a project is reproducible, and every later improvement can be measured honestly against it.
Common mistakes
MistakeSharing a notebook that has only ever been run cell by cell, out of order.
InsteadRestart the kernel and run all cells top to bottom before trusting or sharing any result.
MistakeReporting the best result from one lucky seed.
InsteadFix seeds for repeatability, run several, and report the mean and spread.
MistakeEditing raw data files by hand.
InsteadKeep raw data read-only and make every correction in documented, rerunnable code.
MistakeAbsolute file paths and magic numbers scattered through the code.
InsteadUse paths relative to the project root (pathlib) and put settings in configuration or function arguments.
MistakeCommitting passwords, API keys or large data files to Git.
InsteadUse .gitignore, environment variables or a secrets manager, and data versioning tools for large files.
Summary and key terms
- Reproducibility means someone else, or you later, can rerun the work and get the same results; it comes from habits practised from the start.
- Notebooks suffer from hidden state; restart and run all, keep them linear and move reusable code into modules.
- Seed every random generator, pass seeds explicitly, and report results over several seeds.
- Record environments with pinned lock files (and containers for full isolation) and print versions with results.
- Keep raw data read-only, script all cleaning, and record data fingerprints (hashes) or use data versioning tools.
- Use a standard project layout: README, data/raw and processed, src, notebooks, tests, results; use relative paths.
- Use Git with small, well-described commits; never commit secrets.
- Write tests for known answers, edge cases and data expectations, and grow notebooks into one-command pipelines.
- Reproducibility
- The ability to rerun an analysis and obtain the same results.
- Kernel
- The Python process behind a notebook that runs cells and holds variables in memory.
- Hidden state
- Variables and results in a notebook's memory that no longer match the code shown on the page.
- Restart and run all
- Restarting the kernel and running every notebook cell from the top, to verify there is no hidden state.
- Random seed
- A starting value that makes random number generation repeatable.
- Lock file
- A file recording the exact versions of every installed package.
- Container
- A packaged, isolated environment (such as a Docker image) that runs the same everywhere.
- Hash (fingerprint)
- A short value computed from data that changes if any part of the data changes, such as SHA-256.
- Data versioning
- Tracking which version of each data set was used, alongside code versions.
- Git
- A version control system that records project history as commits.
- Commit
- A recorded snapshot of a project with a message describing the change.
- .gitignore
- A file listing paths Git should not track, such as data, outputs and secrets.
- Unit test
- A small automated check that a piece of code gives the expected result.
- pytest
- A popular Python tool that finds and runs test functions.
- Pipeline
- A sequence of steps run in order, ideally with one command, from raw data to results.
Practice problems
Work each problem on paper first, then reveal the answer to check.
A notebook's cells show execution counts [3], [1], [7], [2]. What does that tell you and what should you do?
Show answer
The cells were run out of order, so outputs may reflect hidden state. Restart the kernel and run all cells top to bottom, then check the results.
Why should a function that splits data take a seed argument instead of calling a global random function?
Show answer
An explicit seed makes the split repeatable and independent of other code that uses random numbers, and it documents which seed produced a result.
Three seeds give accuracies 84.1, 85.3 and 84.6%. Report the result.
Show answer
Mean 84.7%, range 84.1–85.3% (about ±0.6 points) over 3 seeds.
What command records the exact package versions of the current pip environment?
Show answer
pip freeze > requirements.txt.
A file's SHA-256 hash recorded with last month's results differs from today's hash of the file with the same name. What does that mean?
Show answer
The file's contents have changed (even if only one byte), so results may not be comparable; find the original version or rerun with the new data and note the change.
Where in the standard layout would you put: a function that cleans sensor data; the original export from the building management system; a figure for the final report; a test for the cleaning function?
Show answer
src/ (e.g. src/project/cleaning.py); data/raw/; results/ (or reports/figures/); tests/test_cleaning.py.
Rewrite the path "C:/Users/sam/Desktop/racks_final.csv" in a portable way for a project that keeps it in data/raw.
Show answer
from pathlib import Path; path = Path("data") / "raw" / "racks.csv" (relative to the project root).
Write a test that checks a function energy_kwh([10, 10, 10, 10]) returns 10.0 for 15-minute readings.
Show answer
def test_energy(): assert energy_kwh([10, 10, 10, 10]) == 10.0 (four 15-minute readings of 10 kW total 10 kWh).
Give two data expectations you could test after merging a table of readings with a table of sensors.
Show answer
The row count is unchanged after a left merge; no rows have a missing sensor location; sensor IDs in the sensor table are unique; power values are non-negative.
A teammate committed an API key to a shared repository and then deleted it in the next commit. Is the problem solved?
Show answer
No: the key remains in the repository history. Revoke and replace the key immediately, then keep secrets out of the repository with environment variables or a secrets manager.
Lesson quiz · 5 questions
Score 60% or more to complete this lesson.
Create a free account to save your progress, take quizzes and earn a certificate.