
AI-110 · Lesson 4 of 12 · 31 min
Simulation, sampling and the bootstrap
Lesson 3 introduced NumPy arrays and seeded random number generators. This lesson puts them to work. Many questions in data and AI work are hard to answer with formulas but easy to answer by simulation: generate thousands or millions of random scenarios that follow the rules of the problem, and count what happens. The same idea, resampling the data you already have, gives honest uncertainty estimates for almost any statistic, and shuffling labels tests whether a difference between two groups could be chance. These techniques are the computational backbone of modern statistics and are used throughout machine learning, from estimating model accuracy to evaluating A/B tests.
Monte Carlo simulation
A Monte Carlo simulation estimates a quantity by random sampling. The recipe is always the same:
1. Describe one random scenario in code (one "trial").
2. Run many independent trials, ideally vectorized so that NumPy does them all at once.
3. Compute the fraction or average of interest across the trials.
4. Report the estimate together with its uncertainty, which shrinks as the number of trials grows.
The method is named after the casino in Monaco; it was developed by scientists at Los Alamos in the 1940s, who used early computers to simulate neutron transport.
A reliability question
A data hall has 20 cooling units and needs at least 19 running to remove the full heat load (an N+1 design). Each unit is unavailable 2% of the time, for failures or maintenance, independently of the others. What fraction of the time is the hall short of cooling?
import math
import numpy as np

n_units, p_down, needed = 20, 0.02, 19   # 20 cooling units, each down 2% of the time; 19 must run

rng = np.random.default_rng(42)
trials = 200_000
down = rng.random((trials, n_units)) < p_down      # True where a unit is down
short = (n_units - down.sum(axis=1)) < needed       # fewer than 19 running
print(f"Simulated P(capacity short): {short.mean():.5f}")

exact = 1 - sum(math.comb(n_units, k) * p_down**k * (1 - p_down)**(n_units - k) for k in range(2))
print(f"Exact binomial answer:       {exact:.5f}")
print("Hours per year short:", round(exact * 8760, 1))Simulated P(capacity short): 0.06005 Exact binomial answer: 0.05990 Hours per year short: 524.7
The simulation builds a 200,000 × 20 Boolean array in one call, True wherever a unit is down, sums each row to count the units down, and averages the result. The exact answer comes from the binomial distribution: the hall is short when two or more units are down, so \(P = 1 - P(0) - P(1)\). The two agree to three decimal places.
The real power of simulation shows when the problem changes in ways that break the formula: units that fail together because they share an electrical feed, maintenance that is scheduled rather than random, repair times that vary. Each change is a few lines of code in the simulation and might be a research problem for the formula.
Worked problem
Reading the result
The hall is short of cooling with probability 0.0599. (a) How many hours a year is that? (b) Is the design adequate?
Show solution
- (a) \(0.0599 \times 8{,}760 = 525\) hours a year.
- (b) About 22 days a year with less than full cooling capacity is not acceptable for most data centres.
Answer: About 525 hours a year. An N+1 design with 20 units has a high chance that two are out at once; designers either add more redundancy (N+2), use fewer, larger units, or schedule maintenance so that it never coincides with a failure. Simulation lets them compare these options quickly (DCE-200).
How accurate is a simulation?
A simulated probability is itself a random estimate. If the true probability is \(p\) and the simulation runs \(n\) independent trials, the standard error of the estimate is
and an approximate 95% confidence interval is the estimate ± 1.96 SE. The error shrinks with the square root of \(n\): to make it ten times smaller you need a hundred times more trials.
import numpy as np

rng = np.random.default_rng(7)
p_true = 0.0599
for n in [100, 10_000, 1_000_000]:
    hits = rng.random(n) < p_true
    est = hits.mean()
    se = np.sqrt(est * (1 - est) / n)
print(f"n = {n:>9,}: estimate {est:.4f} +/- {1.96 * se:.4f}")n = 100: estimate 0.0900 +/- 0.0561 n = 10,000: estimate 0.0577 +/- 0.0046 n = 1,000,000: estimate 0.0597 +/- 0.0005
With 100 trials the estimate of 0.09 is far from the true value of about 0.06 and its interval is wide; with a million it is within 0.0005. Always report the number of trials and the resulting uncertainty, and be especially careful with rare events: estimating a probability of one in a million needs many millions of trials, or special techniques such as importance sampling.
Sampling and the sampling distribution
The same logic applies to data. A data set is usually a sample from a larger population: 40 repair jobs out of all the repairs that will ever happen, 14 days of energy readings out of all possible days. Any statistic computed from the sample, a mean, a median, a model's accuracy, would come out differently with a different sample. The spread of a statistic across possible samples is its sampling distribution, and its standard deviation is the standard error. A result without some measure of this uncertainty can mislead badly, especially with small samples.
For a sample mean of \(n\) independent values with standard deviation \(s\), the classical formula is \(SE = s/\sqrt{n}\). But for medians, percentiles, ratios, correlations and model metrics, no simple formula exists, and for skewed data the formula's assumptions may fail. The bootstrap solves both problems.
The bootstrap
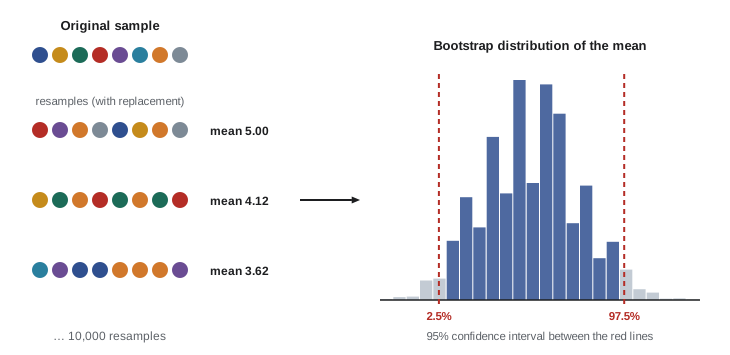
The bootstrap, introduced by Bradley Efron in 1979, treats the sample as a stand-in for the population. It draws many new samples of the same size from the data with replacement (so some values appear twice and others not at all), computes the statistic on each, and uses the spread of those values as the sampling distribution. The 2.5th and 97.5th percentiles of the bootstrap values give an approximate 95% confidence interval (the percentile method).
import numpy as np

rng = np.random.default_rng(3)
repair_h = np.round(rng.lognormal(mean=1.0, sigma=0.9, size=40), 1)   # 40 observed repair times, hours
print("Sample mean", round(repair_h.mean(), 2), "| median", np.median(repair_h), "| max", repair_h.max())

B = 10_000
idx = rng.integers(0, repair_h.size, size=(B, repair_h.size))   # resample with replacement
boot_means = repair_h[idx].mean(axis=1)
boot_medians = np.median(repair_h[idx], axis=1)

lo, hi = np.percentile(boot_means, [2.5, 97.5])
print(f"95% bootstrap CI for the mean:   {lo:.2f} to {hi:.2f} h")
lo, hi = np.percentile(boot_medians, [2.5, 97.5])
print(f"95% bootstrap CI for the median: {lo:.2f} to {hi:.2f} h")Sample mean 4.89 | median 2.2 | max 54.1 95% bootstrap CI for the mean: 2.81 to 7.95 h 95% bootstrap CI for the median: 2.05 to 3.65 h
The repair times are strongly skewed: most jobs take a couple of hours, but one took 54. The mean is pulled up by the long jobs and is uncertain: its interval spans almost a factor of three. The median is more stable. The whole bootstrap takes one line of fancy indexing: repair_h[idx] builds a 10,000 × 40 array of resamples, and .mean(axis=1) computes all 10,000 means at once (Lesson 3).
Worked problem
Which number to report?
A manager asks "How long does a repair take?" Using the output above, what should the answer be?
Show solution
- Typical repair: the median, about 2.2 hours (95% CI about 2.1 to 3.7 h).
- Average repair: about 4.9 hours, but with a wide 95% interval of about 2.8 to 8 h, driven by a few very long jobs.
- Planning staff time needs the mean (total hours = mean × number of jobs); setting customer expectations needs the median and a high percentile.
Answer: Say that a typical repair takes about 2 hours, that the average is about 5 hours because a few repairs take much longer, and that with only 40 jobs the average is uncertain. Reporting a single number without its uncertainty, or the mean of skewed data as if it were typical, are common and avoidable mistakes.
The bootstrap is not magic. It cannot invent information the sample lacks: with very small samples, or for statistics such as the maximum that depend on rare extreme values, its intervals are unreliable. It also assumes the observations are independent; for time series, resample blocks of consecutive values instead of single points.
Comparing groups with a permutation test
A common question is whether a change made a difference: did a new fan control strategy reduce energy use, did a new model version reduce errors? If the two groups differ, how sure can we be that the difference is not chance?
A permutation test answers directly. If the change had no effect, the labels "old" and "new" are arbitrary, and shuffling them should produce differences as large as the observed one quite often. So we shuffle the labels many times, compute the difference each time, and count how often the shuffled difference is at least as large as the real one. That fraction is the p-value.
import numpy as np

rng = np.random.default_rng(11)
old = rng.normal(412, 18, size=14)   # daily cooling energy, MWh, old control
new = rng.normal(398, 18, size=14)   # after the new fan control
observed = old.mean() - new.mean()
print(f"Old {old.mean():.1f} MWh/day, new {new.mean():.1f} MWh/day, difference {observed:.1f}")

pooled = np.concatenate([old, new])
diffs = np.empty(20_000)
for i in range(diffs.size):
    perm = rng.permutation(pooled)
    diffs[i] = perm[:14].mean() - perm[14:].mean()
p_value = np.mean(diffs >= observed)
print(f"Permutation p-value (one-sided): {p_value:.4f}")Old 415.5 MWh/day, new 390.5 MWh/day, difference 25.0 Permutation p-value (one-sided): 0.0003
Only about 3 in 10,000 shuffles produced a difference as large as the observed 25 MWh/day, so chance alone is a very unlikely explanation. Note what the test does and does not show. A small p-value says the difference is unlikely to be due to chance in the sampling; it does not say how big the effect really is (for that, give a bootstrap confidence interval for the difference) and it cannot rule out other causes, such as cooler weather in the second two weeks. Good experiments randomize which days get which treatment, or run both at the same time on comparable equipment, to rule such causes out.
Worked problem
The danger of many comparisons
An analyst tests 20 different changes, none of which has any real effect, using a p-value threshold of 0.05 for each. What is the probability that at least one appears significant?
Show solution
- Each test has a 5% chance of a false positive.
- Probability none is a false positive: \(0.95^{20} = 0.358\).
- Probability at least one: \(1 - 0.358 = 0.642\).
Answer: About 64%. Testing many things and reporting only the "significant" ones produces false discoveries. Decide on the comparisons in advance, correct the threshold for the number of tests (the Bonferroni correction would use 0.05/20 = 0.0025), and confirm surprising results with new data.
Simulating a decision
Simulation also supports decisions under uncertainty. A team must decide how many spare optical transceivers to keep on site. Failures arrive randomly at a known average rate, and replacements take six weeks to arrive. Too few spares means waiting with a failed link; too many ties up money. Failures that occur independently at a constant rate follow a Poisson distribution, which NumPy samples directly.
import numpy as np

rng = np.random.default_rng(2026)
fleet, afr = 6000, 0.012          # transceivers in service, annual failure rate
lead_weeks = 6                    # weeks to receive replacements
mean_failures = fleet * afr * lead_weeks / 52
demand = rng.poisson(mean_failures, size=100_000)   # failures during one lead time

print(f"Expected failures per lead time: {mean_failures:.1f}")
for spares in [8, 10, 12, 14]:
print(f"{spares:>2} spares on the shelf -> enough {np.mean(demand <= spares):.1%} of the time")Expected failures per lead time: 8.3 8 spares on the shelf -> enough 55.2% of the time 10 spares on the shelf -> enough 78.6% of the time 12 spares on the shelf -> enough 92.1% of the time 14 spares on the shelf -> enough 97.7% of the time
With about 8.3 expected failures per lead time, holding 8 spares is enough only about 55% of the time, while 12 covers about 92% and 14 about 98%. The team can now choose a service level explicitly and see what it costs. Holding the expected number of failures is a classic mistake: because demand varies, stocking exactly the average runs out about half the time.
Reproducibility and good practice
- Always create a generator with a seed (np.random.default_rng(seed)) and record the seed, so results can be reproduced exactly (Lesson 11).
- Check a simulation against a case with a known answer, as K6 did with the binomial formula, before trusting it on harder cases.
- Report the number of trials and the Monte Carlo uncertainty.
- Vectorize: generating one large array is usually tens to hundreds of times faster than a Python loop of single draws.
- State the assumptions, especially independence. Correlated failures, seasonal patterns and dependence between observations are where simulations and bootstraps most often go wrong.
Common mistakes
MistakeReporting a simulated probability without its uncertainty.
InsteadGive the number of trials and a confidence interval.
MistakeReporting the mean of skewed data as "typical".
InsteadReport the median and percentiles as well, with bootstrap intervals.
MistakeBootstrapping time series point by point.
InsteadResample blocks of consecutive observations to keep the dependence.
MistakeTreating a small p-value as proof of a large or causal effect.
InsteadEstimate the effect size with an interval and design the comparison to rule out other causes.
MistakeStocking spares equal to the average demand.
InsteadChoose a service level and stock enough to meet it.
Summary and key terms
- Monte Carlo simulation estimates quantities by running many random trials and counting outcomes.
- Simulation error shrinks with the square root of the number of trials.
- Every statistic has a sampling distribution; its spread is the standard error.
- The bootstrap resamples the data with replacement to give confidence intervals for any statistic.
- Permutation tests shuffle group labels to see whether a difference could be chance.
- Many comparisons produce false positives unless thresholds are corrected.
- Simulation supports decisions such as spares levels; seeds make it reproducible.
- Monte Carlo simulation
- Estimating a quantity by repeated random sampling.
- Trial
- One simulated random scenario.
- Standard error
- The standard deviation of an estimate across possible samples.
- Sampling distribution
- The distribution of a statistic over repeated samples.
- Bootstrap
- Resampling the data with replacement to estimate uncertainty.
- Confidence interval
- A range that would contain the true value in a stated fraction of repeated studies.
- Permutation test
- A test that shuffles labels to build the distribution of a statistic under no effect.
- p-value
- The probability of a result at least as extreme as observed if there were no real effect.
- Poisson distribution
- The distribution of counts of independent events occurring at a constant average rate.
- Service level
- The fraction of periods in which demand is met from stock.
Practice problems
Work each problem on paper first, then reveal the answer to check.
A simulation of 10,000 trials estimates p = 0.2. Approximate 95% margin of error?
Show answer
1.96 × √(0.2 × 0.8 / 10,000) ≈ 0.008.
How many times more trials are needed to halve the error?
Show answer
4.
Ten units, each down 5% of the time independently. Probability all are up?
Show answer
0.95¹⁰ ≈ 0.599.
In bootstrapping, samples are drawn with or without replacement?
Show answer
With replacement, the same size as the data.
Which is more stable for skewed repair times, the mean or the median?
Show answer
The median.
A sample of 25 values has standard deviation 10. Standard error of the mean?
Show answer
2.
In a permutation test, 120 of 10,000 shuffles beat the observed difference. p-value?
Show answer
0.012.
Ten independent tests at 0.05 with no real effects. P(at least one false positive)?
Show answer
1 − 0.95¹⁰ ≈ 40%.
Expected failures per lead time are 5. Is stocking 5 spares enough?
Show answer
Only about 62% of the time for a Poisson(5) demand; more are needed for a high service level.
Why record the seed of a simulation?
Show answer
So the exact results can be reproduced.
Lesson quiz · 5 questions
Score 60% or more to complete this lesson.
Create a free account to save your progress, take quizzes and earn a certificate.