
AERO-350 · Lesson 1 of 12 · 34 min
Systems engineering for aircraft
An aircraft is a flying collection of systems. The wing, fuselage and engines that earlier courses analysed carry the load, but almost everything the crew touches, and almost everything that keeps the passengers alive, is a system: electrical power, hydraulics, fuel, cabin air, ice protection, landing gear, the sensors that measure speed and attitude, the radios and navigation receivers, the displays and the software that ties them together. On a modern business jet these systems account for a large part of the empty weight, most of the wiring, a large part of the purchase price and most of the maintenance hours. This course works through them one by one, using the two aircraft that Borealis Aerospace has been developing in Winnipeg: the Tern Block 2 hybrid-electric utility aircraft and the Swift 900 business jet study.
Élise Fournier, the chief engineer, opens the course for the new systems hires the same way every year. She puts a single slide on the screen with the Tern's failure conditions and says that the systems engineer's real job is to make sure that every one of them is either impossible enough or survivable enough. The rest of this lesson explains what she means: how aircraft systems are developed, how their safety is assessed, and how the rules of Transport Canada connect the two.
Systems engineering and the development process
Systems engineering is the discipline of turning what an aircraft must do into equipment that does it, and of proving that the equipment does it. Aircraft programmes follow a recognisable pattern, often drawn as a V. On the left side, requirements flow downward: aircraft-level functions, such as provide propulsive power or provide attitude information, are allocated to systems, then to items such as a generator, a software application or a circuit board. At the bottom of the V the items are built. On the right side, integration and verification flow upward: each item is tested against its requirements, the system against its requirements, and finally the aircraft against its functions in ground and flight test.
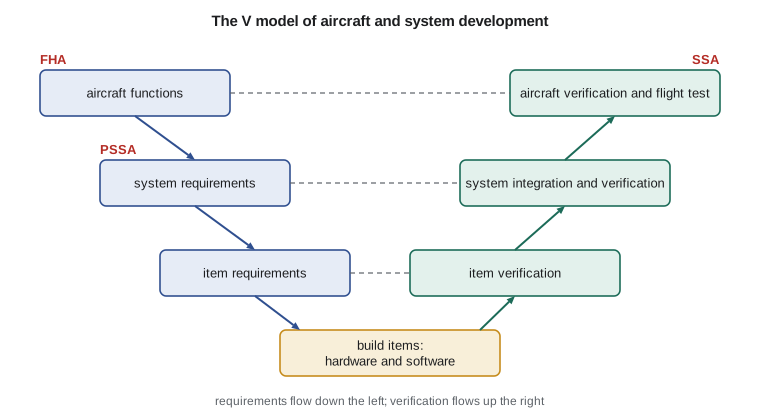
The industry guidance for this process is SAE ARP4754, Guidelines for Development of Civil Aircraft and Systems, now in revision B, published at the end of 2023. A companion document, ARP4761, describes the safety assessment methods; it too was revised in 2023 as ARP4761A. Regulators accept these documents as one acceptable way to show that a complex system meets the airworthiness rules, and in practice almost every new aircraft programme in Canada and the United States uses them. They do not tell engineers how to design a generator; they tell them how to organise requirements, how to trace each requirement to its verification, how to manage changes and how to assign the level of rigour each part of the system needs.
Three ideas from ARP4754B appear again and again in this course. The first is traceability: every requirement has a parent above it and a verification below it, so that when a test fails, or when a requirement changes, engineers can see everything that is affected. The second is independence: the people who check a safety-critical design should not be the people who wrote it, and the most critical functions should not depend on a single piece of equipment or a single design team's assumptions. The third is development assurance: since nobody can test every possible combination of inputs to a complex system, the confidence that it has no design errors comes from the rigour of the process used to build it, and that rigour is scaled to how much harm an error could do.
Failure conditions and their classification
The safety assessment begins with a functional hazard assessment, usually shortened to FHA. The team lists the aircraft's functions and asks, for each one, what happens if it is lost, or if it works wrongly without anyone noticing. Each of these failure conditions is classified by its worst credible effect on the aircraft, the crew and the occupants. The usual five classes are catastrophic, hazardous, major, minor and no safety effect.
| Class | Typical effect | Average probability per flight hour (transport category) | Development assurance level |
|---|---|---|---|
| Catastrophic | Multiple fatalities, usually with loss of the aircraft | Extremely improbable: 10⁻⁹ or less | A |
| Hazardous | Large reduction in safety margins; serious or fatal injury to a small number of people; crew workload so high they may not perform tasks accurately | Extremely remote: 10⁻⁷ or less | B |
| Major | Significant reduction in margins; crew workload increase; physical distress to occupants | Remote: 10⁻⁵ or less | C |
| Minor | Slight reduction in margins; slight workload increase; some inconvenience | Probable: 10⁻³ or less | D |
| No safety effect | No effect on safety | No requirement | E |
The probabilities in the table are averages per flight hour over the fleet's life, and they make an important point: the more severe the effect, the less likely it must be. A failure condition that could kill everyone on board must be so improbable that it is not expected to happen in the whole life of all the aircraft of the type. A minor inconvenience can be allowed to happen now and then. The rule that sets this relationship in law is the system safety standard in section 525.1309 of Transport Canada's Airworthiness Manual (523.2510 for normal category aeroplanes such as the Tern). For smaller aeroplanes the accepted targets are less demanding and depend on the class of aeroplane, but for the Tern's novel hybrid propulsion Élise has set the company's own target at the transport-category value of 10⁻⁹ per flight hour for total loss of propulsive power, and Transport Canada has accepted that approach in its special conditions.
Two further rules sit beside the numbers. A catastrophic failure condition must not result from any single failure, however unlikely that failure appears, so a single cable, a single bolt or a single software error cannot be allowed to bring the aircraft down. And the crew must be told about failures that need their action, and must have the information and the time to act. Many of the systems decisions in this course come from those two rules rather than from any arithmetic.
From the FHA to the system design
Once the FHA is complete, the team carries out a preliminary system safety assessment, the PSSA, on the proposed architecture. It asks whether the planned design can meet the targets and what each piece must contribute. Fault trees are the main tool. A fault tree starts with a failure condition at the top and works downward through logic gates. An OR gate means that any one of the events below it causes the event above; an AND gate means that all of them must happen. Failure rates are assigned to the basic events at the bottom, and the probability of the top event is calculated.
For independent events, the probability through an OR gate is approximately the sum of the input probabilities when they are small, and the probability through an AND gate is their product. Exposure time matters for AND gates: two independent failures must happen in the same flight, or one must remain undetected until the other occurs. A latent failure, one that nobody knows about until it is needed, is the systems engineer's quiet enemy, because its exposure time is not one flight but the interval between the checks that would find it.
Arjun Mehta, working his first systems assignment, builds the Tern's fault tree for loss of all propulsive power. In the Block 2 design, the turboshaft-driven generator and the battery both feed a single high-voltage power distribution unit, which supplies the two propeller motors. Each motor is fed from both sources, so the loss of one motor is only a major failure condition: the Tern can climb and land on one. But if both energy sources fail in the same flight, or if the distribution unit fails, both propellers stop.
# Functional hazard assessment for three Tern Block 2 functions, with design assurance level
# allocation and a simple fault tree check of the "loss of all propulsive power" failure condition.
# Probabilities and failure rates are illustrative teaching values.
classes = {  # severity: (largest allowed average probability per flight hour, development assurance level)
    'catastrophic': (1e-9, 'A'), 'hazardous': (1e-7, 'B'), 'major': (1e-5, 'C'),
    'minor': (1e-3, 'D'), 'no safety effect': (None, 'E')}
fha = [
    ('Loss of all propulsive power in flight', 'catastrophic'),
    ('Loss of one propeller motor', 'major'),
    ('Erroneous battery state of charge shown to the crew', 'hazardous'),
    ('Loss of cabin reading lights', 'no safety effect'),
    ('Loss of the turboshaft generator, battery available', 'major'),
]
print(f"{'failure condition':52s} {'class':17s} {'limit /fh':>9s}  DAL")
for name, cls in fha:
    lim, dal = classes[cls]
    print(f"{name:52s} {cls:17s} {('%.0e' % lim) if lim else '   -':>9s}   {dal}")

# Fault tree: all propulsive power is lost only if BOTH energy sources fail (AND gate) or the
# single power distribution unit fails (OR gate above it).
lam_gen = 2.0e-4      # turboshaft + generator loss rate per flight hour
lam_batt = 5.0e-5     # battery system loss rate per flight hour
lam_pdu = 2.0e-10     # power distribution unit, designed with internal redundancy
t = 1.5               # average flight time in hours; exposure for the AND gate
p_and = (lam_gen * t) * (lam_batt * t) / t   # both fail in the same flight, per flight hour
p_top = p_and + lam_pdu
print(f"\nboth sources lost in one flight: {p_and:.1e} per flight hour")
print(f"top event incl. distribution unit: {p_top:.1e} per flight hour; limit 1e-09 -> "
      + ('meets' if p_top <= 1e-9 else 'does NOT meet'))
for t2 in (1.5, 3.0, 6.0):
    p = (lam_gen * t2) * (lam_batt * t2) / t2 + lam_pdu
    print(f"   with {t2:3.1f} h flights: {p:.1e}")

# Design change: split the battery into two independent strings, each able to land the aircraft.
p_strings = (lam_batt * t) ** 2                     # both strings lost in the same flight
p_and2 = (lam_gen * t) * p_strings / t
print(f"\nwith two battery strings: {p_and2 + lam_pdu:.1e} per flight hour -> "
+ ('meets' if p_and2 + lam_pdu <= 1e-9 else 'does NOT meet'))failure condition class limit /fh DAL Loss of all propulsive power in flight catastrophic 1e-09 A Loss of one propeller motor major 1e-05 C Erroneous battery state of charge shown to the crew hazardous 1e-07 B Loss of cabin reading lights no safety effect - E Loss of the turboshaft generator, battery available major 1e-05 C both sources lost in one flight: 1.5e-08 per flight hour top event incl. distribution unit: 1.5e-08 per flight hour; limit 1e-09 -> does NOT meet with 1.5 h flights: 1.5e-08 with 3.0 h flights: 3.0e-08 with 6.0 h flights: 6.0e-08 with two battery strings: 2.0e-10 per flight hour -> meets
The first result does not meet the target. With the generator chain failing at 2 × 10⁻⁴ per flight hour and the battery system at 5 × 10⁻⁵, losing both in the same 1.5 hour flight has an average probability of about 1.5 × 10⁻⁸ per flight hour, fifteen times the target, and longer flights make it worse because the exposure grows. Arjun's first instinct is to ask for more reliable equipment, but Élise points out that improving each component tenfold is expensive and hard to prove. The design change that is easy to prove is architectural: split the battery into two independent strings, with separate contactors and separate cooling, each able to supply enough power to land. Now the battery side of the AND gate is itself an AND of two independent strings, and the top event falls to about 2 × 10⁻¹⁰ per flight hour, dominated by the distribution unit, which has its own internal redundancy.
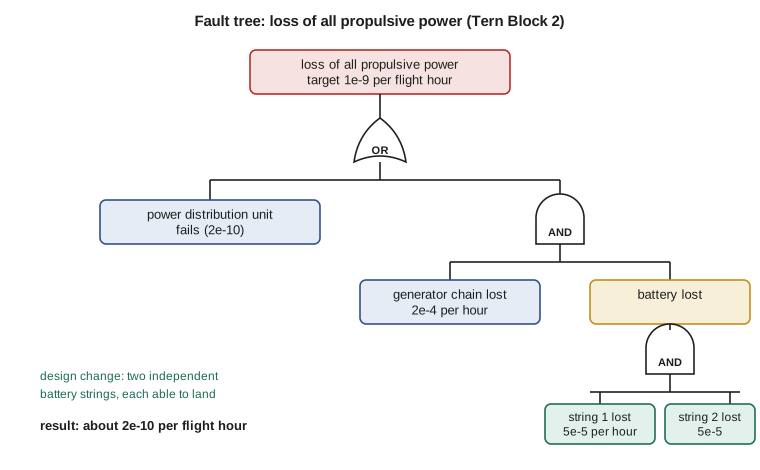
Two cautions come with this result. First, the AND gates only work if the failures really are independent. A fire in the battery bay, a single coolant pump shared by both strings, a software error common to both battery management units or a lightning strike that couples into both harnesses would defeat them. The common cause analysis, which ARP4761A divides into a zonal safety analysis, a particular risks analysis and a common mode analysis, looks for exactly these threats. Second, a failure rate on a slide is only as good as the evidence behind it, and for new equipment such as high-voltage battery packs the evidence is thin. The team therefore keeps generous margins and plans to update the analysis with service data.
Development assurance levels
Quantitative probability works well for hardware that fails at random, such as a bearing or a capacitor. It does not work for design errors, which are systematic: the same software bug is present in every unit, and it either appears under a given set of conditions or it does not. For such errors the industry uses development assurance levels, or DALs, labelled A to E. A function whose failure could be catastrophic is assigned level A, and the software and complex hardware that implement it must be developed with the most rigorous process; at level E no particular process is needed. Lesson 12 explains how DO-178C and DO-254 turn these levels into specific objectives for software and electronic hardware.
ARP4754B allows a function's level to be reduced when it is implemented by independent members. If two dissimilar channels, developed by different teams with different tools, each perform a level A function, the guidance allows the channels to be assigned lower levels, provided the independence is real and demonstrated. The Tern's two battery management units are an example: rather than buy two identical units, the team is considering one in-house design and one from a supplier, which would make a common software error far less credible. The decision will be made on cost and schedule as well as safety, and the analysis will record why.
Systems integration and the aircraft
The systems are not independent of each other. The electrical system powers the fuel pumps, which feed the turboshaft, which drives the generator; the hydraulic system on the Swift 900 depends on engine-driven pumps and electric pumps; the flight control computers depend on air data and inertial sensors; and almost everything depends on cooling. A mature programme therefore keeps an interface control document for every connection between systems and runs integration rigs, sometimes called iron birds, where real equipment is connected and exercised together long before first flight. Borealis Aerospace has a Tern systems rig in its Winnipeg hangar with the real battery, distribution unit and motors driving propeller load simulators, and a smaller rig for the Swift 900 flight control computers.
Environmental qualification is the other half of integration. Equipment must keep working in the cold soak of a northern ramp, the heat of a summer tarmac, vibration, humidity, lightning-induced transients and the radio fields of the airport. RTCA DO-160, Environmental Conditions and Test Procedures for Airborne Equipment, now in revision G, gives the standard test categories, and most equipment purchase specifications name the DO-160 categories the supplier must meet. The Tern's high-voltage equipment adds tests that few small aircraft have needed before, including partial discharge testing at altitude pressure, which Lesson 2 explains.
Worked problem
Classifying a failure condition
On the Swift 900, the cabin pressure controller could command an uncontrolled depressurization at 12 500 m. Oxygen masks deploy automatically and the crew must descend. What class would the FHA most likely assign, and what probability target follows?
Show solution
- The effect is a large reduction in safety margin, possible injury and high crew workload, but with masks and a descent the occupants are expected to survive.
- That fits hazardous; the target is \(10^{-7}\) per flight hour or less, with development assurance level B for the controller's software.
Answer: Hazardous, \(10^{-7}\) per flight hour, level B. If the masks or the descent could not be relied on, the class would rise to catastrophic.
Worked problem
An AND gate with a latent failure
A standby pump has a failure rate of 1 × 10⁻⁴ per hour but is only checked every 500 hours. The main pump fails at 2 × 10⁻⁴ per hour. Estimate the average probability per flight hour of losing both.
Show solution
- The standby can be failed and unnoticed for up to 500 h; average exposure about 250 h, so its probability of being failed is \(1\times10^{-4} \times 250 = 0.025\).
- Combined: \(2\times10^{-4} \times 0.025 = 5\times10^{-6}\) per flight hour.
Answer: About 5 × 10⁻⁶ per flight hour, dominated by the latent exposure; checking the standby every flight would cut it by more than a hundred times.
Worked problem
An OR gate
A display can be lost through its power supply (3 × 10⁻⁶ per hour), its processor (2 × 10⁻⁶) or its data bus (1 × 10⁻⁶). Estimate the probability of losing the display.
Show solution
- For small independent probabilities an OR gate adds them: \(3 + 2 + 1 = 6\times10^{-6}\) per flight hour.
Answer: About 6 × 10⁻⁶ per flight hour; a second display is needed if loss of the information is worse than major.
Certification basis and special conditions
Every type certificate starts with a certification basis: the list of airworthiness rules, at a particular amendment, that the design must meet. For a conventional aircraft the basis is simply the current standards for its category. For an aircraft with features the rules did not anticipate, such as the Tern's high-voltage hybrid propulsion or the Swift 900's fly-by-wire pitch law, the regulator adds special conditions, extra requirements written for that design. Transport Canada has issued special conditions for the Tern covering battery thermal runaway containment, high-voltage electrical safety, the crew's indications of available energy and the protection of the propulsion system against lightning. Many of them follow conditions already used for other electric and hybrid aircraft, which saves time for everyone.
Means of compliance are agreed early. For each requirement, the applicant proposes how it will show compliance: by analysis, by ground test, by flight test, by inspection or by similarity to a previously certified design. The plan is written in a certification plan and the regulator decides how deeply to be involved. Borealis Aerospace's Design Approval Representatives, engineers authorised to act on the regulator's behalf for some findings, carry much of the routine work, but the novel parts of the Tern remain under direct regulatory review.
The systems engineer's documents form a chain from the top down: the aircraft functions list, the FHA, the system requirements, the PSSA and fault trees, the common cause analyses, the item requirements, the test plans and reports, and finally the system safety assessment, the SSA, which shows that the design as built meets the targets. Élise's slide with the Tern's failure conditions is the top of that chain; the rest of this course fills in the links.
Worked problem
Exposure and flight length
Two independent units each fail at 1 × 10⁻⁵ per hour and are both checked before every flight. Find the probability per flight hour of losing both on a 1 h flight and on a 10 h flight.
Show solution
- Per flight: \((10^{-5} t)^2\); per flight hour divide by \(t\): \(10^{-10} t\).
- 1 h: \(1\times10^{-10}\); 10 h: \(1\times10^{-9}\).
Answer: The longer flight is ten times worse per hour, which is why long-range aircraft need more redundancy for the same target.
Common mistakes
MistakeTreating a very low failure rate as a substitute for redundancy.
InsteadA catastrophic failure condition must not result from any single failure, however reliable.
MistakeAssuming AND-gate inputs are independent without checking.
InsteadShared zones, power, cooling, software and lightning paths must be examined in the common cause analysis.
MistakeUsing one flight as the exposure time for a failure that is only detected at maintenance.
InsteadLatent failures are exposed for the whole check interval.
MistakeAssigning a development assurance level from the equipment's cost or complexity.
InsteadThe level follows the worst failure condition the function can contribute to.
Summary and key terms
- Aircraft systems are developed with a structured process, described in ARP4754B, that allocates aircraft functions to systems and items and verifies each level.
- The functional hazard assessment classifies failure conditions from catastrophic to no safety effect; more severe conditions must be less probable, and no single failure may cause a catastrophe.
- Fault trees with AND and OR gates estimate probabilities, with exposure time and latent failures handled carefully, while common cause analysis tests the independence that AND gates assume.
- Development assurance levels A to E set the rigour for software and complex hardware.
- Functional hazard assessment
- A systematic list of aircraft functions and how their loss or malfunction would affect safety.
- Failure condition
- An effect on the aircraft and its occupants caused by one or more failures.
- Fault tree
- A diagram that combines basic failures through AND and OR gates to estimate the probability of a top event.
- Latent failure
- A failure that is not detected when it occurs and remains until a check finds it or another failure exposes it.
- Development assurance level
- A letter from A to E that sets how rigorously a function or item must be developed.
- Common cause analysis
- The analysis that looks for single events able to defeat redundant equipment.
Practice problems
Work each problem on paper first, then reveal the answer to check.
A function's loss is hazardous. What probability target and assurance level apply on a large aeroplane?
Show answer
10⁻⁷ per flight hour or less, level B.
In the program, change the average flight to 3 hours with the original single battery. Does the design meet the target?
Show answer
No: about 3 × 10⁻⁸ per flight hour.
Why can't the team simply buy a generator ten times more reliable?
Show answer
It is costly and hard to prove; an architectural change gives a provable improvement.
Give one common cause that could defeat the two battery strings.
Show answer
A fire in the shared bay, a shared coolant pump or a common software error.
Which document gives the safety assessment methods that accompany ARP4754B?
Show answer
ARP4761A.
What does DO-160G cover?
Show answer
Environmental test conditions and procedures for airborne equipment.
Lesson quiz · 5 questions
Score 60% or more to complete this lesson.
Create a free account to save your progress, take quizzes and earn a certificate.