
NUC-330 · Lesson 7 of 12 · 21 min
Critical heat flux
On the wall of Rohan's office hangs a framed photograph of an electrically heated test rod with a short blackened band near its top. "That band was at 1000 degrees about four seconds after we passed critical heat flux in a test loop," he tells Hana. "Below the band, the rod was nucleate boiling at a few kelvin superheat. The heat flux was the same above and below. The only difference was whether liquid could still reach the wall. Every thermal limit for a water-cooled reactor core is built around keeping a margin to that moment."
What critical heat flux is
Critical heat flux (CHF) is the heat flux at which the heat transfer from a boiling surface deteriorates sharply because liquid can no longer wet the wall. If heat input is controlled, as it is in a fuel rod where the fission rate sets the heat flux, passing CHF causes the wall temperature to jump, by hundreds of kelvin for a heat-flux-controlled surface, until a new, much less efficient mode of heat transfer can remove the heat. The sheath may then oxidize rapidly, lose strength or fail. Avoiding CHF in normal operation and in anticipated transients is therefore one of the most important design requirements for water-cooled reactor cores.
The phenomenon is known by several names, which reflect two mechanisms.
| Name | Mechanism | Typical conditions |
|---|---|---|
| Departure from nucleate boiling (DNB) | a vapor blanket forms at the wall in subcooled or low-quality flow, cutting off liquid | high heat flux, high pressure, subcooled or low quality: PWRs |
| Dryout | the liquid film in annular flow evaporates or is torn away and the wall dries | moderate heat flux, high quality: BWRs and CANDU hot channels |
| Boiling crisis, burnout | general terms covering both | older literature and some codes |
DNB is a local, abrupt phenomenon. Bubbles crowd the wall so densely that they coalesce into a vapor patch; once a patch forms, it grows and the wall temperature runs away quickly. Dryout is more gradual. In annular flow, the liquid film on the wall thins as it evaporates and as droplets are torn from it, while droplets from the core are deposited back. When the film thickness reaches zero at some point, the wall dries. Post-dryout temperature excursions are usually smaller than after DNB, because the vapor core still contains droplets and moves fast, but they are still well above normal operating temperatures.
What critical heat flux depends on
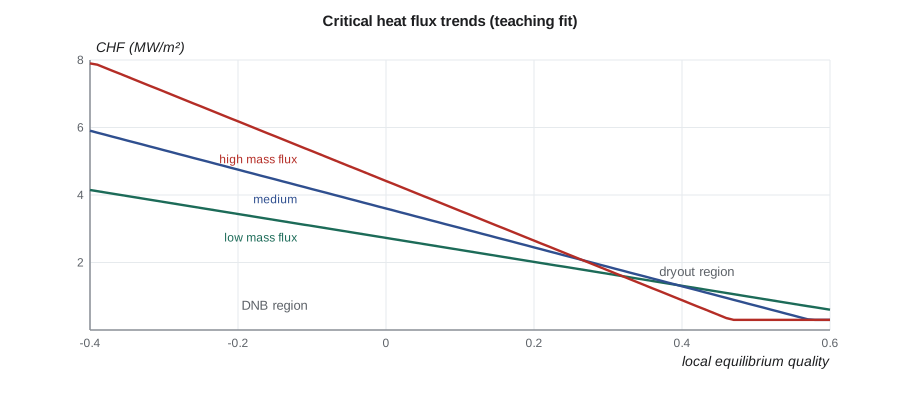
CHF in a uniformly heated tube depends mainly on pressure, mass flux and local quality, and also on diameter, heated length and the axial heat flux shape.
| Parameter | Effect on CHF (typical trend) | Physical reason |
|---|---|---|
| Local quality rises | CHF falls strongly | less liquid available to wet the wall |
| Mass flux rises (low quality) | CHF rises | faster flow sweeps bubbles away |
| Mass flux rises (high quality) | CHF may fall | more entrainment from the film |
| Pressure | CHF peaks at moderate pressures, about 3 to 10 MPa | surface tension and latent heat both fall at high pressure |
| Smaller diameter | CHF rises somewhat | thinner boundary layers |
| Non-uniform axial heating | local CHF depends on upstream history | the film or bubble layer remembers conditions upstream |
Look-up tables and correlations
Because CHF depends on so many variables, designers rely on large experimental databases. The most widely used general tool is the CHF look-up table developed by Groeneveld and colleagues, a table of CHF values for a reference 8 mm vertical water-cooled tube as a function of pressure, mass flux and quality. Its 2006 version was derived from a compilation of more than 25,000 data points drawn from 62 data sets gathered over about sixty years, and the underlying data were later published by the NRC. Correction factors adjust the table values for diameter, bundle geometry, heated length, axial flux shape and spacer devices. Look-up tables are used in system codes for transient analysis because they cover a very wide range of conditions.
For licensing, each fuel design has its own CHF correlation, fitted to tests of full-scale electrically heated bundles that reproduce the actual geometry, grids and appendages. In the United States, PWR vendors have proprietary DNB correlations; the older, public W-3 correlation of Tong is still taught as an example of the form these correlations take. BWR critical power correlations, also proprietary, are fitted to bundle tests that measure the bundle power at which dryout first occurs. Each correlation comes with a statistically determined design limit, explained below.
CANDU bundles, used in Canada, have their own CHF correlations, developed from full-scale bundle tests in Freon and water loops. Their results are expressed as the critical channel power: the channel power at which dryout first occurs somewhere in the channel.
Margins: DNBR, CHFR and critical power ratio
Thermal margins are expressed as ratios. For a PWR, the departure from nucleate boiling ratio at each height is
where the CHF is evaluated at the local conditions predicted by a subchannel calculation. The minimum DNBR along the hottest channel is the quantity that must stay above its limit. Because the local CHF falls as quality rises along the channel while the heat flux follows the cosine, the minimum DNBR usually lies above the mid-plane, between the heat flux peak and the outlet.
For BWRs and CANDU reactors, where the concern is dryout, the margin is usually expressed in terms of power rather than local heat flux. The critical power ratio for a BWR bundle is the bundle power at which dryout would first occur, at the same flow, pressure and inlet subcooling, divided by the actual bundle power; the minimum value in the core, MCPR, must stay above its operating limit. CANDU analysts use the analogous critical channel power ratio.
Power-based ratios are used where dryout depends on the whole upstream history of the channel; a local heat flux ratio would understate the effect of raising power everywhere at once.
Worked problem
Minimum DNBR in a hot PWR channel
A hot channel has a peak heat flux of 1.45 MW/m² with a chopped cosine shape, a mass flux of 3600 kg/m²·s and pressure 15.5 MPa. Using the lesson's teaching CHF fit, estimate the DNBR along the channel and find its minimum.
Show solution
- March up the channel, adding heat to find the local enthalpy and equilibrium quality, which rises from about −0.34 at the inlet to about 0 near the outlet.
- At each node, compute the teaching CHF from the local quality and divide by the local heat flux.
- At the mid-plane, CHF ≈ 4.3 MW/m² and the heat flux 1.45 MW/m², giving DNBR ≈ 2.9; slightly above the mid-plane, the falling CHF and the still-high heat flux give the minimum.
Answer: Minimum DNBR about 2.8, a little above the mid-plane. Real analyzes use the licensed correlation for the fuel and subchannel conditions; the teaching fit only shows the shape of the calculation.
# Critical heat flux margins: an illustrative look-up style CHF function, DNBR along a channel,
# and a critical-power ratio. The CHF function is a TEACHING FIT, not a licensed correlation.
import math
def chf_teaching(G, x, p_MPa):
    """Illustrative CHF (MW/m2) falling with quality and rising with mass flux; shape only."""
    base = 3.6 * (G / 3000.0) ** 0.4 * math.exp(-(p_MPa - 10.0) ** 2 / 200.0)
    return max(0.2, base * (1.0 - 1.6 * x))
L, Le, qmax_pp = 3.66, 3.86, 1.45e6       # PWR hot channel, peak heat flux W/m2
G, p = 3600.0, 15.5
h_in, h_f, h_fg = 1.296e6, 1.630e6, 0.965e6  # J/kg, rounded for 15.5 MPa
Dh_heat = 9.5e-3; m_per_area = G
N = 20; dz = L / N; h = h_in; minr = (99, 0)
for i in range(N):
    z = -L / 2 + (i + 0.5) * dz
    qpp = qmax_pp * math.cos(math.pi * z / Le)
    h += qpp * math.pi * Dh_heat * dz / (G * 8.8e-5)      # subchannel flow area 88 mm2
    x = (h - h_f) / h_fg
    r = chf_teaching(G, x, p) * 1e6 / qpp
    if r < minr[0]: minr = (r, z, x)
    if i % 4 == 1: print(f"z = {z:+5.2f} m: x_e = {x:+5.2f}, q'' = {qpp/1e6:4.2f} MW/m2, DNBR = {r:4.2f}")
print(f"minimum DNBR {minr[0]:.2f} at z = {minr[1]:+.2f} m (x_e = {minr[2]:+.2f})")
# Critical power ratio for a CANDU-style channel (illustrative numbers)
P_channel, P_critical = 6.6, 8.3     # MW
print(f"critical channel power ratio = {P_critical/P_channel:.2f} (margin {100*(P_critical/P_channel-1):.0f} %)")z = -1.56 m: x_e = -0.33, q'' = 0.44 MW/m2, DNBR = 11.74 z = -0.82 m: x_e = -0.27, q'' = 1.14 MW/m2, DNBR = 4.20 z = -0.09 m: x_e = -0.17, q'' = 1.45 MW/m2, DNBR = 2.94 z = +0.64 m: x_e = -0.07, q'' = 1.26 MW/m2, DNBR = 2.96 z = +1.37 m: x_e = -0.01, q'' = 0.64 MW/m2, DNBR = 5.33 minimum DNBR 2.81 at z = +0.27 m (x_e = -0.12) critical channel power ratio = 1.26 (margin 26 %)
Design limits and the 95/95 criterion
No CHF correlation is exact. When a correlation is compared with the tests used to build it, the ratio of measured to predicted CHF scatters around 1 with a standard deviation of perhaps 5 to 10 percent. The design limit on DNBR is therefore set above 1 by enough to ensure, with high probability and high confidence, that CHF will not occur. In the United States the common criterion is that there must be at least a 95 percent probability, at a 95 percent confidence level, that the hot rod does not experience DNB. For a correlation with modest scatter, this gives a correlation limit of about 1.1 to 1.3. Further allowances for uncertainties in power, flow, pressure and temperature can be added to the limit or treated statistically, as Lesson 8 explains.
In both countries, the margins are quantified with statistical methods. In the CANDU reactors used in Canada, for example, the regional overpower protection trip setpoints are calculated so that, with high confidence, the trip occurs before any channel reaches dryout, with uncertainties and aging effects included.
Enhancing critical heat flux
Because CHF limits power, much fuel design effort goes into raising it. Mixing-vane grids in PWR assemblies stir the flow downstream of each grid, breaking up the bubbly layer near hot rods and raising DNB heat flux by tens of percent. BWR spacer designs improve droplet deposition onto the film near the top of the bundle and delay dryout. In CANDU fuel, the 43-element CANFLEX bundle design uses elements of two diameters and turbulence-enhancing buttons to raise critical channel power relative to the 37-element design. Enhancements must be demonstrated in full-scale tests before they can be credited in licensing.
CHF in transients
In fast transients, the heat flux, flow and pressure all change, and CHF may be reached briefly before conditions recover. Experiments show that CHF during transients is roughly what a steady-state correlation predicts at the instantaneous local conditions, provided the changes are not extremely fast; this quasi-steady assumption underlies most transient analysis. After CHF, the sheath temperature rise depends on how long the condition lasts and on the post-CHF heat transfer. If cooling recovers quickly enough, the sheath rewets and returns to nucleate boiling with no damage; this is why a brief dryout during some CANDU or BWR transients can be acceptable under derived acceptance criteria based on sheath temperature and time, even though dryout is avoided in normal operation.
Hana reads the BWR critical power ratio limit in the BWRX-300 construction permit material and notices that it is not just one number but depends on the fuel design and operating state. "Good," says Rohan. "Next week you find out where all those numbers in the margin stack come from."
Why look-up tables are not used for licensing alone
A general look-up table predicts CHF in a smooth round tube. Fuel bundles differ in ways that strongly affect CHF: unheated walls such as the pressure tube or guide tubes, non-uniform heating among rods, spacer grid and appendage design, and cold-wall effects near the channel boundary. Correction factors capture some of these effects, but each fuel design's own tests remain the best evidence. For this reason, look-up tables are mainly used in system codes for transient conditions over wide ranges, while licensing margins in steady state and anticipated transients rest on fuel-specific correlations with their statistically derived limits.
Summary and key terms
- Critical heat flux is where boiling heat transfer deteriorates because liquid can no longer wet the wall; at controlled heat flux the wall temperature jumps.
- DNB occurs at high heat flux and low quality; dryout occurs at high quality when the annular film disappears.
- CHF falls with quality, depends on mass flux and pressure, and is affected by geometry and heat flux history.
- The Groeneveld look-up table is a general tool; licensing uses correlations fitted to full-scale bundle tests.
- Margins are expressed as DNBR for PWRs and as critical power ratios for BWRs and CANDU reactors.
- Design limits are set statistically, for example at 95 percent probability with 95 percent confidence.
- Critical heat flux
- The heat flux at which boiling heat transfer deteriorates sharply.
- Departure from nucleate boiling
- CHF caused by vapor blanketing at high heat flux and low quality.
- Dryout
- CHF caused by depletion of the liquid film in annular flow.
- DNBR
- The ratio of predicted CHF to the actual local heat flux.
- Critical power ratio
- The ratio of the power at which dryout would begin to the actual power of a bundle or channel.
- Look-up table
- A tabulation of CHF against pressure, mass flux and quality for a reference geometry.
Practice problems
Work each problem on paper first, then reveal the answer to check.
At a point where the predicted CHF is 3.0 MW/m² and the actual heat flux 1.5 MW/m², what is the DNBR?
Show answer
2.0.
Why is the minimum DNBR usually above the mid-plane?
Show answer
CHF falls as quality rises along the channel, while the heat flux is still high just above the mid-plane.
Why are power-based ratios used for dryout?
Show answer
Dryout depends on the whole upstream heating history, so a local ratio would misstate the margin when power rises everywhere.
Why is Freon used in some CANDU bundle CHF tests?
Show answer
It reproduces water's dimensionless conditions at lower pressure and power, making full-scale tests cheaper.
Name one design feature used to raise CHF in PWR fuel.
Show answer
Mixing-vane spacer grids.
Lesson quiz · 5 questions
Score 60% or more to complete this lesson.
Create a free account to save your progress, take quizzes and earn a certificate.