
MBA-513 · Lesson 5 of 12 · 23 min
Lean operations and the Toyota Production System
Dr. Raman begins the fifth session with a story from her first job. In the early 2000s, her plant supplied seat frames to a Toyota assembly plant, and one morning a Toyota supplier development engineer arrived for a two-day visit. He spent the first three hours standing in one spot near the welding area, watching, and asked only one question, about why a stack of frames sat on the floor beside the third robot. By the end of the visit, the plant had reorganized one line so that frames moved one at a time between operations instead of in baskets of forty. Within a month, floor space for that line had fallen by a third, the time from steel to finished frame had fallen from three days to less than one, and the scrap rate had halved, because defects were found at the next operation instead of a basket later. That, she says, is lean in practice: not a set of tools but a way of seeing waste.
From mass production to the Toyota Production System
Henry Ford's moving assembly line, introduced at Highland Park in 1913, cut the time to assemble a Model T chassis from about twelve hours to about an hour and a half, and mass production became the dominant model of manufacturing for half a century. It relied on long runs of standardized products, dedicated machines, large buffers of inventory between stages and inspection at the end of the line. After the Second World War, Toyota could not copy it. The Japanese market was small and demanded many models, capital was scarce, and the company could not afford large inventories or dedicated machines for each part. Over the following decades, under Taiichi Ohno and with the help of Shigeo Shingo, it developed a different system.
The Toyota Production System rests on two pillars. The first is just-in-time: producing only what is needed, when it is needed, in the quantity needed, so that each process makes what the next process has just used. The second is jidoka, often translated as automation with a human touch: building into machines and processes the ability to detect an abnormality and stop, so that defects are not passed on. Jidoka goes back to Sakichi Toyoda, the founder of the Toyota group, whose automatic loom of 1924 stopped itself when a thread broke. Both pillars rest on a foundation of heijunka, or leveled production, standardized work and continuous improvement, kaizen. In the 1980s, the joint venture between General Motors and Toyota at Fremont, California, known as NUMMI, showed that the system could transform a plant with an American workforce: a former GM plant with some of the worst quality and absenteeism in the company became one of its best within a few years. James Womack, Daniel Jones and Daniel Roos documented the gap between Japanese and Western plants in their 1990 book The Machine That Changed the World, which made the word lean, coined by their colleague John Krafcik, the general name for the approach.
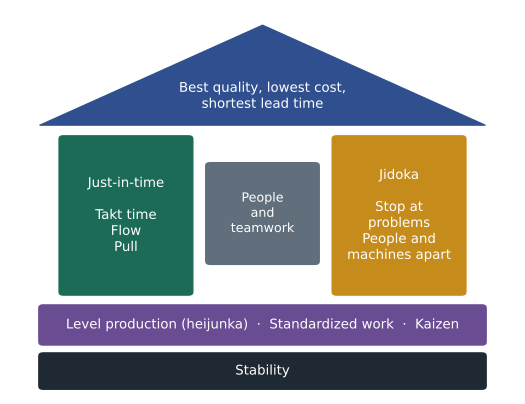
The seven wastes
Ohno defined waste, muda in Japanese, as any activity that consumes resources without adding value the customer would pay for, and he listed seven kinds. Overproduction, making more or earlier than needed, is the worst, because it causes most of the others. Waiting is time when people or machines are idle or units sit in queues. Transportation is moving materials farther or more often than necessary. Overprocessing is doing more work than the customer requires, such as polishing a hidden surface. Inventory is any stock beyond what is needed now. Motion is unnecessary movement of people, such as walking to fetch tools. Defects are any work that must be redone or scrapped. Many practitioners add an eighth, unused human talent: failing to use the ideas and skills of the people who do the work.
Toyota also identified two related problems: mura, unevenness in production or workload, and muri, overburdening people or equipment. They are linked. An uneven schedule, with heavy demand at the end of each month as salespeople rush to meet targets, overburdens the plant at some times and leaves it idle at others, and the overburdened periods produce defects and accidents that create more waste. That is why leveling the schedule is the foundation of the system rather than an afterthought. Grace recognizes all three in Fairway's warehouse, where promotions planned weeks ahead still produce frantic peaks, overtime and damaged cases in the week a flyer runs.
Inventory hides problems
Lean thinking treats inventory not as an asset but as a symptom. Ohno compared it to water in a river that hides rocks: with plenty of water, a boat sails over the rocks without anyone knowing they are there; lower the water, and the rocks appear and must be removed. Buffers of inventory between operations protect a process from machine breakdowns, quality problems, late suppliers and long changeovers, so the problems persist. Reducing the buffers deliberately, one step at a time, exposes the problems and forces the organization to solve them. Dr. Raman stresses that the order matters. Taking inventory out of an unstable process without fixing the causes simply produces stockouts, which is why the quality and dependability of lesson 4 come first.
Pull and kanban
In a push system, production is scheduled from a forecast, and each operation makes its planned quantity and pushes it to the next, whether or not the next operation needs it yet. In a pull system, production is triggered by actual use: when a downstream process consumes material, it signals the upstream process to replace it. Toyota's signal is the kanban, a card attached to a container. When a container of parts is emptied at the assembly line, its card goes back to the supplying operation as an authorization to make exactly one more container. Because nothing can be produced without a card, the number of cards in circulation caps the work in process, and by Little's law it also caps the flow time. Supermarket replenishment, which Ohno said had inspired him on a visit to American stores in the 1950s, works the same way: shelves are restocked as customers take goods.
The number of kanban containers needed for a part depends on demand during the replenishment lead time, the size of each container and a safety allowance for variation. With demand D per hour, a replenishment lead time of L hours, a safety factor alpha and C units per container, the number of containers is the expression below, rounded up. Daniel's welding cells use two weld nuts per bracket, so at a demand of 450 brackets an hour they consume 900 nuts an hour. Nuts are replenished from the stores area with a lead time of 4 hours, the safety factor is 10 percent, and a container holds 500 nuts, so the cells need 900 × 4 × 1.1 / 500 = 7.9, or 8 containers. Reducing the number of containers over time, while watching for stockouts, is how a lean plant lowers the water in the river.
Quick changeovers
Small batches are essential to flow, but every batch needs a changeover, and long changeovers push managers toward long runs. Shigeo Shingo's method of single-minute exchange of die, known as SMED, attacks the changeover itself. Its first step is to separate internal setup, work that can be done only while the machine is stopped, from external setup, work that can be done while it is still running, such as fetching the next die, preheating it and preparing tools. Its second is to convert internal work to external wherever possible, and its third is to streamline what remains, with standard die heights, quick clamps instead of bolts, and carts that bring the die to the right position. Shingo reported cutting changeovers on large presses from hours to under ten minutes, and the name reflects the goal of a changeover measured in single digits of minutes.
The payoff can be taken in two ways. Suppose a batch of B brackets is produced after a setup of S seconds and each bracket takes p seconds while the press runs. The press then makes B brackets every S + Bp seconds, so its capacity is B / (S + Bp). Northfield's press runs at 8 seconds per bracket and currently changes dies once per shift, in batches of about 3,000 brackets with 50-minute changeovers, giving 400 brackets an hour. Cutting changeovers to 10 minutes can either raise capacity, by keeping the batch size, or cut inventory, by keeping the capacity and making smaller batches more often. The average stock of each part number held between production runs, called cycle inventory, is about half the batch size, so smaller batches mean less inventory and shorter flow times.
import math
p = 8.0   # seconds per bracket while the press is running

def capacity(batch, setup_min):
    return 3600 * batch / (setup_min * 60 + batch * p)   # brackets per hour

print("Batch   50-min setup   10-min setup   cycle stock per part")
for batch in (600, 1000, 1500, 3000, 6000):
    print(f"{batch:5} {capacity(batch, 50):11.0f}/h {capacity(batch, 10):12.0f}/h {batch / 2:14.0f}")

# Smallest batch that still gives 400 an hour with 10-minute changeovers
need = 400 / 3600
batch = need * 600 / (1 - need * p)
print(f"Batch for 400 an hour with 10-minute setups: {batch:.0f} (was 3,000)")

# Kanban containers for weld nuts
D, L, alpha, C = 900, 4, 0.10, 500
print(f"Kanban containers: {D * L * (1 + alpha) / C:.2f} -> {math.ceil(D * L * (1 + alpha) / C)}")Batch 50-min setup 10-min setup cycle stock per part 600 277/h 400/h 300 1000 327/h 419/h 500 1500 360/h 429/h 750 3000 400/h 439/h 1500 6000 424/h 444/h 3000 Batch for 400 an hour with 10-minute setups: 600 (was 3,000) Kanban containers: 7.92 -> 8
The table shows the trade-off. With 50-minute changeovers, the press needs batches of 3,000 or more to reach 400 an hour, and each part number carries an average of 1,500 brackets of cycle stock. With 10-minute changeovers, the same 3,000-bracket batches give 440 an hour, or the plant can cut the batch to 600, change dies five times a shift, keep capacity at 400 an hour and hold one-fifth of the inventory. Daniel's team chooses a middle path for now: batches of about 1,500, giving roughly 430 brackets an hour and half the cycle stock, combined with moving three simple part numbers to an older press to close the rest of the gap to demand. Dr. Raman notes that the choice can be revisited as the changeover keeps improving, which is the point of kaizen.
Value stream mapping
Mike Rother and John Shook's 1998 workbook Learning to See popularized value stream mapping, a way of drawing the whole flow of material and information needed to bring a product to a customer. The current-state map shows each process, the inventory between processes, the information flows that trigger production and the time a unit spends at each stage. A timeline along the bottom separates value-added time, when the product is actually being transformed, from total lead time. The ratio of the two is the process cycle efficiency, and in most processes it is shockingly low: a few percent or less. The team then draws a future-state map with less inventory, more flow, pull where flow is impossible and a single scheduling point, and plans the steps to get there.
The cohort maps a Cedarline winter jacket from the moment a purchase order is placed. Fabric is ordered from a mill and takes about 45 days to produce and deliver to the sewing factory. Cutting and sewing a production lot takes about 30 days in the factory, of which the actual work on any one jacket is under two hours. Finished cartons wait about a week to fill a container, sail for about four weeks, then spend about 12 days at the port, on rail and in transit to the distribution center. Receiving and putting away take about five days, the average jacket then sits in the distribution center for about 40 days and travels three days to a store, where it sits on average another five weeks before it is sold. The total is about 205 days. The value-added time, in which fabric is knitted, dyed, cut, sewn and finished, is about five and a half days, so process cycle efficiency is under 3 percent.
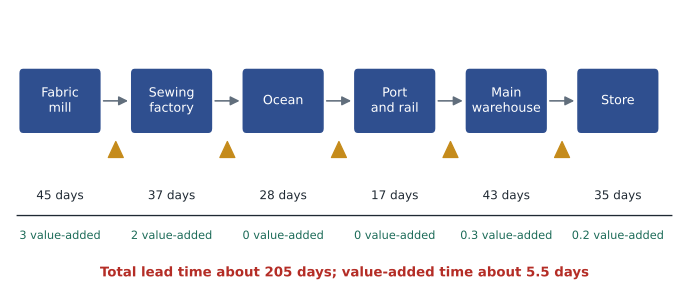
The map changes the conversation. Cedarline's managers had assumed that the long lead time was set by ocean shipping and could not be changed. The map shows that the ocean leg is only 28 of 205 days; most of the time is waiting, in fabric queues, in the distribution center and on store shelves. Some of it can be cut without moving a single factory. Fabric in Cedarline's core shades could be bought in advance and held at the mill, undyed or in standard shades, cutting weeks from the order lead time. The distribution center could ship to stores weekly in smaller quantities instead of in large seasonal waves. And store stock could be set by what each store sells rather than by a chain-wide allocation. Lessons 9 to 12 return to these choices with numbers.
Lean beyond the factory
Lean methods have spread far beyond car plants. Virginia Mason Medical Center in Seattle adopted the Toyota Production System as its management method in 2002, sending executives to Japan and introducing a patient safety alert system modeled on Toyota's andon cord, which lets any worker stop the line when something is wrong. Hospitals, banks, insurers and software teams have used value stream mapping to cut lead times for approvals, claims and releases. Hana's team maps the path of an emergency patient who needs admission and finds that the longest wait, often several hours, is not for a doctor but for a bed, because discharges on the wards happen late in the afternoon. Moving discharge planning to the morning, a classic leveling change, is now her first project.
Dr. Raman closes with two cautions. First, lean is not the same as cost cutting or having no inventory at all. Toyota holds buffers where variability cannot yet be removed, and after the earthquake and tsunami in Japan in 2011 it built a supplier database and asked key suppliers to hold stocks of critical parts, which helped it weather the semiconductor shortage of 2021 better than many rivals. Second, the tools fail without the culture. Many firms copied kanban cards and value stream maps but not the daily habit of going to the place where work is done, which Toyota calls the gemba, asking why five times to find root causes, and giving workers the time and authority to improve their own work. NUMMI succeeded because Toyota changed how managers treated workers, not because it changed the machines.
Worked problem
A kanban loop for Fairway's bakery
Fairway's new central bakery line will supply sandwich loaves to stores. Demand averages 2,400 loaves an hour across the chain during the production day. The replenishment lead time from a store's signal to delivery is 6 hours, trays hold 12 loaves, and the bakery uses a safety factor of 15 percent. How many trays should circulate, how many loaves of inventory does that allow, and what is the implied flow time?
Show solution
- Containers: N = 2,400 × 6 × 1.15 / 12 = 1,380 trays.
- Maximum inventory in the loop is 1,380 × 12 = 16,560 loaves, about 6.9 hours of demand.
- By Little's law, at 2,400 loaves an hour, a full loop of 16,560 loaves corresponds to a flow time of about 6.9 hours from baking to shelf, compared with the 6-hour lead time; the extra is the safety allowance.
- If the bakery cuts the lead time to 4 hours with an extra delivery run, the loop needs 2,400 × 4 × 1.15 / 12 = 920 trays, cutting inventory and the age of bread on the shelf by a third.
Answer: The number of kanbans directly caps inventory and flow time. Shortening the lead time is the lever that lets Fairway deliver fresher bread with less stock, a lean change that also serves the order winner identified in lesson 1.
Common mistakes
MistakeLean means having no inventory.
InsteadLean removes inventory that hides problems, after the problems are fixed; buffers remain where variability cannot yet be removed.
MistakeLong production runs are always more efficient.
InsteadLong runs save changeovers but create overproduction and inventory; quick changeovers make small batches economic.
MistakeLean is a set of tools such as kanban and value stream maps.
InsteadThe tools work only with the habits of going to the gemba, solving root causes and engaging the people who do the work.
MistakeLead time is mostly processing and transport time.
InsteadValue stream maps typically show that waiting accounts for almost all lead time.
Summary and key terms
- The Toyota Production System rests on just-in-time and jidoka, on a foundation of leveled production, standardized work and kaizen.
- Ohno's seven wastes are overproduction, waiting, transportation, overprocessing, inventory, motion and defects; mura and muri cause more waste.
- Inventory hides problems; lowering it step by step exposes problems to be solved.
- Pull systems use kanban signals; the number of kanbans caps work in process and flow time.
- SMED cuts changeovers, so firms can choose higher capacity or smaller batches and less cycle inventory.
- Value stream maps separate value-added time from lead time; process cycle efficiency is usually a few percent.
- Just-in-time
- Producing only what is needed, when needed, in the quantity needed.
- Jidoka
- Building in the ability to detect abnormalities and stop, so defects are not passed on.
- Muda
- Waste: activity that consumes resources without adding value for the customer.
- Kanban
- A signal, often a card on a container, that authorizes production or delivery of a fixed quantity.
- SMED
- Shingo's method for reducing changeover time by separating and streamlining setup work.
- Value stream map
- A diagram of the material and information flows that bring a product to the customer, with a timeline.
- Process cycle efficiency
- Value-added time divided by total lead time.
Practice problems
Work each problem on paper first, then reveal the answer to check.
A part is used at 300 an hour, replenished with a lead time of 2 hours, in containers of 50, with a 20 percent safety factor. How many kanbans are needed?
Show answer
300 × 2 × 1.2 / 50 = 14.4, so 15 containers.
A machine takes 1 minute per unit and 30 minutes per setup. What is its capacity per hour with batches of 120?
Show answer
120 / (30 + 120) units per minute = 0.8 per minute, or 48 an hour.
A loan application takes 3 hours of actual work but 15 working days of 8 hours from submission to decision. What is its process cycle efficiency?
Show answer
3 / 120 = 2.5 percent.
Which of Ohno's wastes did the basket of forty frames represent in Dr. Raman's story?
Show answer
Mainly inventory and waiting, which also hid defects until a basket later, and some transportation.
Lesson quiz · 5 questions
Score 60% or more to complete this lesson.
Create a free account to save your progress, take quizzes and earn a certificate.