
MBA-513 · Lesson 10 of 12 · 23 min
Supply chain design, sourcing and the bullwhip effect
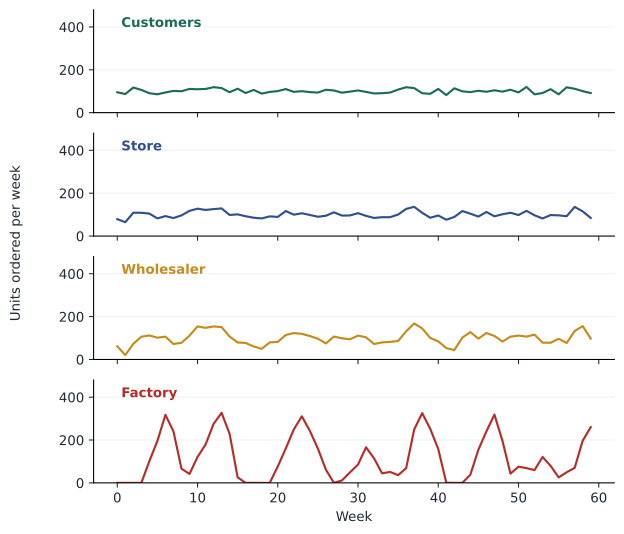
Grace starts the tenth session with a puzzle from Fairway's supplier meetings. Shoppers buy a popular brand of paper towels at an almost constant rate, week after week. Fairway's orders to the manufacturer swing much more widely, because store orders arrive in batches and the chain stocks up whenever the manufacturer runs a promotion. The manufacturer's orders to its own suppliers of pulp swing more widely still, and its plant alternates between overtime and idle shifts. Nobody in the chain is behaving foolishly, Grace says; each is responding sensibly to the orders it sees. Yet the result is a chain in which every stage carries too much inventory at some times and too little at others. Dr. Raman tells the cohort that the pattern has a name, and that it is one of the best-documented phenomena in operations.
What a supply chain is
A supply chain is the network of organizations and flows that turns raw materials into products and delivers them to customers: suppliers and their suppliers, manufacturers, distributors, retailers, logistics providers and the customers themselves. Three flows run through it. Materials move mostly downstream, from suppliers toward customers, and returns move back. Information, about demand, orders, inventory and shipments, moves in both directions. Money moves mostly upstream. Supply chain management coordinates decisions across these organizations, most of which have different owners, incentives and information. The central difficulty is that decisions that look sensible for one firm, such as ordering in large batches to earn a discount, can raise costs for the chain as a whole.
Matching the supply chain to the product
Marshall Fisher of the Wharton School argued in a 1997 article, What is the right supply chain for your product?, that many supply chain problems come from a mismatch between product and chain. Functional products, such as groceries, basic clothing and replacement parts, satisfy stable needs, have long life cycles, predictable demand and low margins; forecast errors of 10 percent are typical. Innovative products, such as fashion apparel, new electronics and toys, have short life cycles, high margins and very uncertain demand, with forecast errors of 40 to 100 percent. Functional products need physically efficient supply chains that minimize production, transport and inventory costs. Innovative products need market-responsive chains that hold buffer capacity and inventory in the right places, cut lead times and react quickly to early sales, because the costs of stockouts and markdowns dwarf the costs of production.
Hau Lee of Stanford extended the framework in 2002 by adding supply uncertainty. A stable supply process, with mature technology and reliable suppliers, differs from an evolving one, with new technology, limited suppliers and unreliable yields. Stable supply with predictable demand calls for efficient chains; stable supply with uncertain demand for responsive chains; evolving supply with predictable demand for risk-hedging chains that pool inventory and share suppliers; and evolving supply with uncertain demand for agile chains that are both responsive and hedged. The cohort sorts Cedarline's assortment into Fisher's categories. Core fleeces, base layers and socks, about 40 percent of revenue, sell steadily year after year and are functional. Fashion-led jackets and seasonal shades, about 60 percent, are innovative. Yet Cedarline buys both the same way, from the same factories, eight months ahead.
| Functional products | Innovative products | |
|---|---|---|
| Examples at Cedarline | Core fleece, base layers, socks | Seasonal jackets, fashion shades |
| Demand | Predictable, long life cycle | Uncertain, one season |
| Typical forecast error | About 10 to 20 percent | About 40 percent or more |
| Cost that dominates | Production and logistics | Stockouts and markdowns |
| Right supply chain | Physically efficient: low cost, full containers, long runs | Market-responsive: short lead times, buffer capacity, staged commitment |
The bullwhip effect
Grace's paper towels show the bullwhip effect: the variability of orders increases as they move upstream in a supply chain, from customers to retailers, wholesalers, manufacturers and their suppliers. Jay Forrester of MIT described the dynamics in his 1958 work on industrial dynamics, and the beer distribution game, developed at MIT in the 1960s, lets players experience it: even when customer demand changes only once, players at four stages of a chain produce wild swings in orders and inventory. In a 1997 article, Hau Lee, V. Padmanabhan and Seungjin Whang named the phenomenon and identified its causes, citing Procter and Gamble's discovery that orders for Pampers diapers from distributors fluctuated far more than the steady consumption of babies.
Lee and his colleagues identified four causes. The first is demand signal processing: each stage forecasts from the orders it receives rather than from end-customer demand, and updates its target stock whenever its forecast changes, so a small rise in demand produces a larger rise in orders as the stage both meets the demand and raises its safety stock. The second is order batching: firms order in batches to cut ordering and transport costs, so a manufacturer sees a few large orders instead of a steady stream. The third is price fluctuation: promotions and quantity discounts lead customers to buy ahead, forward buying, so orders spike during deals and collapse afterward. The fourth is rationing and shortage gaming: when supply is short and allocated in proportion to orders, customers inflate their orders, then cancel them when supply recovers, as happened with semiconductors in 2021 and with many consumer goods in 2020.
import random, statistics as st
rng = random.Random(10)
T = 200
demand = [100 + 10 * (sum(rng.random() for _ in range(12)) - 6) for _ in range(T)]

def orders(incoming, signal, L=2, n=4):
    """Order-up-to policy: target stock is (L + 1) times a moving-average forecast."""
    out, prev = [], None
    for t in range(T):
        if t < n:
            out.append(incoming[t]); continue
        S = (L + 1) * sum(signal[t - n:t]) / n
        out.append(incoming[t] + (S - prev if prev is not None else 0))
        prev = S
    return out

for label, share in (('Each stage forecasts from its own incoming orders', False),
                     ('Every stage sees customer demand', True)):
    print(label)
    flow = demand
    print(f"  {'Customers':12} standard deviation {st.pstdev(demand[20:]):6.1f}")
    for name in ('Store', 'Wholesaler', 'Distributor', 'Factory'):
        flow = orders(flow, demand if share else flow)
print(f" {name:12} standard deviation {st.pstdev(flow[20:]):6.1f}")Each stage forecasts from its own incoming orders Customers standard deviation 9.9 Store standard deviation 14.4 Wholesaler standard deviation 26.9 Distributor standard deviation 55.2 Factory standard deviation 119.7 Every stage sees customer demand Customers standard deviation 9.9 Store standard deviation 14.4 Wholesaler standard deviation 23.4 Distributor standard deviation 33.4 Factory standard deviation 43.7
The simulation uses four stages, each with a two-week lead time and an order-up-to policy based on a four-week moving average, the kind of rule a careful planner might use. Customer demand varies with a standard deviation of about 10 units a week. Store orders vary by about 14, wholesaler orders by 27, distributor orders by 55 and factory orders by about 120, twelve times the variability of customer demand. When every stage forecasts from customer demand instead of the orders it receives, the factory's variability falls to about 44. Sharing information removes the compounding of forecasts, though each stage's own adjustments to its target stock still add some amplification, which is why the most effective remedies also centralize replenishment decisions.
The remedies follow from the causes. Sharing point-of-sale data with suppliers lets every stage plan from real demand; Walmart's Retail Link system gave suppliers access to store-level sales from the early 1990s. Vendor-managed inventory, in which the supplier decides when and how much to replenish its customer's stock, as Procter and Gamble did for Walmart, removes a stage of forecasting altogether. Collaborative planning, forecasting and replenishment, CPFR, formalizes joint forecasts between trading partners. Smaller, more frequent orders, made economic by mixed-truck deliveries and electronic ordering, reduce batching. Everyday low pricing, which Procter and Gamble adopted in the early 1990s, removes the incentive to buy ahead. And allocating scarce supply in proportion to past sales rather than current orders removes the reason to inflate orders.
Make or buy
Every firm decides which activities to perform itself and which to buy from others. The decision has a cost side and a strategic side. On the cost side, managers should compare the total cost of ownership of buying, which includes the price, freight, duties, inspection, inventory carried because of long lead times, the cost of managing the supplier and the cost of quality problems, with the relevant cost of making, which includes only costs that would actually change. The cohort learned in MBA-501 that allocated overhead often makes buying look cheaper than it is. On the strategic side, firms generally keep activities that are core to their competitive advantage, where they have distinctive capabilities or where dependence on a supplier would be dangerous, and buy activities where suppliers have scale, specialized skills or flexibility the firm cannot match. Cedarline designs its products and buys their production, a common choice in apparel because sewing is labor-intensive and contract manufacturers have scale across many brands.
Peter Kraljic's 1983 purchasing portfolio classifies purchases by their profit impact and supply risk. Non-critical items, with low impact and low risk, such as office supplies, should be bought efficiently with simple processes. Leverage items, with high impact and low risk, such as Cedarline's cartons or Northfield's commodity steel, should be bought competitively, using the firm's buying power. Bottleneck items, with low impact but high risk, such as a specialized zipper from a single supplier or Owen's compressor seals, need secured supply through safety stock, long-term contracts or alternatives. Strategic items, with high impact and high risk, such as Cedarline's waterproof membrane fabric or Northfield's relationships with its auto customers, call for close partnerships.
Partnerships work differently from arm's-length bidding. Jeffrey Liker and Thomas Choi described in 2004 how Toyota and Honda built deep supplier relationships in North America: understanding suppliers' operations, turning supplier rivalry into opportunity, monitoring suppliers closely, developing their technical capabilities, sharing information intensively but selectively and conducting joint improvement activities. Dr. Raman worked on the receiving end of this as a supplier and says the demands were relentless but the help was real. Toyota's engineers taught her plant methods that made it more profitable on all its contracts, not only Toyota's.
Network design
A supply chain network decides how many plants and distribution centers to have, where to put them and which customers each serves. The basic trade-off is between facility costs and inventory, which rise with the number of locations, and outbound transport costs and delivery times to customers, which fall. With more distribution centers, each is closer to its customers, so shipments travel shorter distances and arrive faster, but each needs its own safety stock and the pooling benefit of lesson 9 is lost. If demand at each location is independent, total safety stock grows roughly with the square root of the number of locations. Inbound transport, bringing goods from ports or factories to the distribution centers, also tends to rise with more locations because shipments are split into smaller loads.
import math
# Cedarline: annual cost (millions of dollars) with n warehouses, under simple scaling rules
fixed_per_dc = 3.0            # rent, equipment, management per building
outbound_one = 14.0           # outbound freight to stores, chains and households with one warehouse
inbound_one, inbound_step = 2.0, 0.4
safety_one = 1.6              # cost of holding safety stock with one warehouse

print(" n   fixed  outbound  inbound  safety stock  total")
for n in range(1, 5):
    fixed = fixed_per_dc * n
    outbound = outbound_one / math.sqrt(n)        # shorter average distance to customers
    inbound = inbound_one + inbound_step * (n - 1)
    safety = safety_one * math.sqrt(n)            # square-root law of pooling
    total = fixed + outbound + inbound + safety
print(f"{n:2} {fixed:7.1f} {outbound:9.1f} {inbound:8.1f} {safety:13.1f} {total:6.1f}")n fixed outbound inbound safety stock total 1 3.0 14.0 2.0 1.6 20.6 2 6.0 9.9 2.4 2.3 20.6 3 9.0 8.1 2.8 2.8 22.7 4 12.0 7.0 3.2 3.2 25.4
Under these rough assumptions, one and two distribution centers cost almost exactly the same, about 20.6 million dollars a year, while three or four cost more. The second building would make sense only if something tipped the balance: faster delivery to households becoming an order winner, outbound parcel costs rising as online sales grow, or the existing building running out of capacity. That matches the cohort's MBA-511 conclusion that the second distribution center should be deferred and treated as an option, and it adds an operations reason: the existing building's layout, not its size, is the main constraint, and a third-party warehouse can handle seasonal overflow at a variable cost while Cedarline learns how its online business grows.
Postponement and responsive design
Postponement delays the point at which a product takes its final form, moving the decoupling point of lesson 3 downstream. The classic example is Benetton, which in the 1980s began knitting some sweaters undyed and dyeing them only after early sales showed which shades were selling, accepting a higher production cost for a large reduction in forecast error, because demand for sweaters in total is far easier to forecast than demand for each shade. Hewlett-Packard redesigned its desktop printers so that the power supply and manuals for each country were added at regional distribution centers rather than in the factory, so it could hold generic printers and localize them to order. Postponement works by turning many uncertain forecasts into one more accurate aggregate forecast, the same aggregation principle that underlies pooling.
Zara, the Spanish fashion retailer, is the best-known example of a responsive chain for innovative products. It produces a large share of its fashion items in factories in Spain, Portugal, Morocco and Turkey rather than in lower-cost Asian factories, ships to stores twice a week, commits only part of a season's production in advance and uses store sales and manager feedback to decide what to make next. It pays more per garment but sells a much larger share at full price. Cedarline does not need to become Zara, Dr. Raman says, but it can apply the logic selectively: an efficient chain for its functional products and a more responsive one, with shorter lead times and staged commitment, for its innovative ones. Lesson 12 develops that design.
Worked problem
Diagnosing the bullwhip at Fairway
Fairway's orders for a brand of canned soup varied with a standard deviation of 4,800 cases a week last year, while shoppers' purchases varied by only 900 cases. The supplier ran six promotions, during which Fairway bought about three weeks' supply at the deal price. Stores order once a week and the distribution center orders full truckloads of 1,800 cases. Identify the causes of amplification and propose remedies.
Show solution
- Ratio of order variability to demand variability: 4,800 / 900 ≈ 5.3, a strong bullwhip.
- Price fluctuation: forward buying during six promotions creates large order spikes followed by weeks with no orders. Remedy: negotiate everyday low cost or pay-for-performance deals in which the discount applies to units sold to shoppers rather than units bought.
- Order batching: weekly store orders and full-truck purchases turn steady demand into lumpy orders. Remedy: mixed-product trucks so soup can ship in smaller quantities more often, and daily store replenishment for fast movers.
- Demand signal processing: the supplier forecasts from Fairway's orders. Remedy: share point-of-sale data or move to vendor-managed inventory for this category.
Answer: Most of the variability is created by the chain's own pricing and ordering practices rather than by shoppers. Removing forward buying alone would probably cut order variability by more than half, and the supplier, which bears the cost of the swings, has a reason to share the saving with Fairway.
Common mistakes
MistakeEvery product needs the lowest-cost supply chain.
InsteadInnovative products with uncertain demand need responsive chains; the cost of stockouts and markdowns outweighs production savings.
MistakeOrder swings upstream reflect volatile customer demand.
InsteadThe bullwhip effect is mostly created by forecasting from orders, batching, promotions and shortage gaming.
MistakeBuying is cheaper whenever the supplier's price is below full cost.
InsteadCompare the total cost of ownership with the relevant cost of making, and weigh strategic dependence.
MistakeMore distribution centers always improve service.
InsteadThey shorten delivery but raise facility and inventory costs; the trade-off depends on what customers value.
Summary and key terms
- Supply chains move materials downstream, information both ways and money upstream, across firms with different incentives.
- Functional products need efficient chains; innovative products need responsive ones; Lee's framework adds supply uncertainty.
- The bullwhip effect amplifies order variability upstream through demand signal processing, order batching, price fluctuations and shortage gaming.
- Remedies include sharing point-of-sale data, vendor-managed inventory, CPFR, smaller orders, everyday low pricing and allocation by past sales.
- Make-or-buy decisions compare total cost of ownership with relevant cost and weigh strategic dependence; Kraljic's matrix guides sourcing.
- Network design trades facility and inventory costs against transport and speed; postponement delays final form to reduce forecast error.
- Functional product
- A product with stable, predictable demand, a long life cycle and low margins.
- Innovative product
- A product with uncertain demand, a short life cycle and high margins.
- Bullwhip effect
- The increase in order variability as orders move upstream in a supply chain.
- Vendor-managed inventory
- An arrangement in which the supplier decides replenishment of its customer's stock.
- Total cost of ownership
- All costs of acquiring and using a purchased item, beyond its price.
- Kraljic matrix
- A portfolio classifying purchases by profit impact and supply risk.
- Postponement
- Delaying the point at which a product takes its final, specific form.
Practice problems
Work each problem on paper first, then reveal the answer to check.
Customer demand has a standard deviation of 50 units a week and a supplier's orders have one of 300. What is the bullwhip ratio?
Show answer
300 / 50 = 6.
Classify a basic white T-shirt and a limited-edition printed jacket using Fisher's framework, and state the right supply chain for each.
Show answer
The T-shirt is functional and needs an efficient chain; the jacket is innovative and needs a responsive one.
Why does postponement reduce forecast error?
Show answer
It replaces many detailed forecasts with one aggregate forecast until late in the process, and aggregate forecasts are more accurate.
Under the square-root law, how does total safety stock change when a firm moves from one distribution center to four with equal, independent demand?
Show answer
It roughly doubles, because √4 = 2.
Lesson quiz · 5 questions
Score 60% or more to complete this lesson.
Create a free account to save your progress, take quizzes and earn a certificate.