
MBA-513 · Lesson 2 of 12 · 22 min
Process analysis: flow, capacity, bottlenecks and Little's law
Daniel brings a printout to the second session. It shows the bracket line at Northfield's main plant, where steel coil is cut into blanks, formed in a progressive stamping press, welded into subassemblies by robots, painted and packed for shipment to customers. Orders for the line run about 450 brackets an hour across two shifts, but the line ships about 400, and the shortfall is made up with Saturday overtime that the plant can no longer staff. The plant manager has asked for approval to add a third robot welding cell, at a cost of about 1.2 million dollars, because the welders are the newest equipment and their supervisor reports that his cells are running flat out. Dr. Raman asks Daniel a question before he has finished: how many brackets an hour can each step actually process?
This lesson provides the tools for answering that question. They are the foundation of the course: a way of drawing a process, a way of measuring each step's capacity and finding the one that limits the whole, and a law connecting inventory, flow rate and time that holds for almost any stable process, from a bracket line to a hospital to a supply chain.
Drawing a process
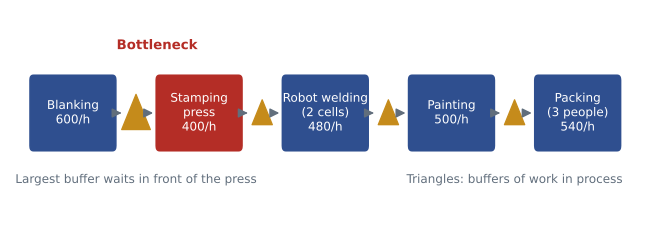
A process flow diagram shows the steps a flow unit passes through and the buffers where it waits. The flow unit is whatever the analysis follows: a bracket, a patient, an order, a dollar of inventory. Steps, also called activities, are drawn as boxes, buffers where units wait as triangles, and the movement of units as arrows. Each step is performed by a resource: a machine, a worker, a team or a room. For each resource the analyst records the processing time per unit, also called the activity time, and the number of parallel units of that resource, such as two welding cells or three packers.
The capacity of a resource is the number of units it can process per unit of time. For a single resource with a processing time of p minutes per unit, capacity is 1/p units per minute; with m identical resources working in parallel, it is m/p. The capacity of the whole process is the capacity of its slowest resource, because every unit must pass through every step. That resource is the bottleneck. A process can never produce faster than its bottleneck, however fast the other steps are.
Northfield's data tell the story. The blanking press cuts a blank every 6 seconds, so it can handle 600 an hour. The progressive stamping press forms a bracket every 8 seconds when it is running, but die changes take about 50 minutes of every 7.5-hour shift, so its effective rate is one bracket every 9 seconds, or 400 an hour. The two robot welding cells each need 15 seconds per bracket, so together they can process 480 an hour. The paint line can handle 500 an hour, and the three packers, at 20 seconds each, 540 an hour. The process capacity is therefore 400 brackets an hour, set by the stamping press, not by the welders. The welders seem to be running flat out because the supervisor sees them busy whenever work arrives, but over a shift they are idle about one-sixth of the time, waiting for the press.
Flow rate, utilization and implied utilization
The flow rate, or throughput, of a process is the smaller of its demand and its capacity. If customers order 450 an hour and the process can make 400, the flow rate is 400, and the process is capacity-constrained. If demand were 350, the flow rate would be 350, and the process would be demand-constrained, with spare capacity at every step. The distinction tells managers where to look. A capacity-constrained process gains output only by expanding the bottleneck; a demand-constrained one gains only by selling more.
Utilization measures how busy a resource is: flow rate divided by capacity. At a flow rate of 400 an hour, the press is 100 percent utilized, the welders 83 percent, painting 80 percent, packing 74 percent and blanking 67 percent. Implied utilization divides demand rather than the actual flow rate by capacity. It can exceed 100 percent, and the step where it is highest is the bottleneck. For Northfield, implied utilization of the press is 450/400, or 112.5 percent: no amount of effort at the press will meet demand without more press capacity. The welders' implied utilization is 94 percent, so they could keep up if the press could.
| Step | Resources | Seconds per unit | Capacity per hour | Utilization at 400 | Implied utilization at 450 |
|---|---|---|---|---|---|
| Blanking | 1 | 6 | 600 | 67 percent | 75 percent |
| Stamping press | 1 | 9 | 400 | 100 percent | 112.5 percent |
| Robot welding | 2 | 15 | 480 | 83 percent | 94 percent |
| Painting | 1 line | 7.2 | 500 | 80 percent | 90 percent |
| Packing | 3 | 20 | 540 | 74 percent | 83 percent |
Two refinements make capacity analysis realistic. First, capacity must use the time a resource is actually available, after planned maintenance, breaks and changeovers. Northfield's press runs many part numbers, and the 50 minutes per shift it loses to die changes are why its effective capacity is 400 an hour rather than the 450 it achieves while running; lesson 5 shows how changeover time can be cut. Second, when a process makes several products with different processing times, capacity depends on the mix. The analyst computes the workload each product places on each resource per hour of demand and finds the resource whose total workload is largest relative to its available time.
Takt time and cycle time
Two related ideas come from manufacturing. Takt time, from the German word for the beat of music, is the available production time divided by customer demand: the pace at which the process must complete units to keep up. Northfield's line has two shifts of 7.5 productive hours, or 54,000 seconds a day, and demand of 6,750 brackets a day, so takt time is 8 seconds. Cycle time is the time between successive units leaving the process, which equals the bottleneck's processing time per unit when the line is capacity-constrained: 9 seconds at the press. Whenever cycle time exceeds takt time, the process cannot keep up. Dr. Raman likes takt time because it gives everyone on the floor a single number to plan to, and makes it obvious which steps cannot meet it.
Little's law
The second big idea of the lesson connects three of the measures introduced in lesson 1. Let I be the average number of flow units in the process, R the average flow rate, and T the average flow time, the time a unit spends in the process from entry to exit. In any process that is stable over the long run, where units do not accumulate without limit, these three are related by Little's law, named after John Little of MIT, who published a general proof in 1961.
The law is remarkable because it requires almost no assumptions. It does not depend on the order in which units are served, the variability of arrivals or processing, or the number of steps. It holds for a bracket line, a hospital, a bank, a supply chain or the balance sheet. Given any two of the three quantities, it gives the third. Daniel's floor count shows an average of about 5,400 brackets in process, as blanks, formed parts, welded subassemblies and painted parts waiting for packing. With a flow rate of 400 an hour, the average bracket takes 5,400 / 400 = 13.5 hours to pass through the line, even though the total processing time of its five steps is under a minute. Almost all of the flow time is waiting.
The law applies directly to inventory in financial terms. If a firm's cost of goods sold flows through inventory at R dollars a year and it holds I dollars of inventory on average, the average dollar spends T = I / R years in inventory. For Cedarline, with cost of goods sold of 235 million dollars and inventory of 128 million, T is 0.54 years, the 199 days of lesson 1. Inventory turns are simply R / I, the reciprocal of flow time. Hana applies the law to Lakeview's new evening clinic. Between 6 and 10 p.m. it sees about 12 patients an hour, and the staff count an average of 18 patients in the building, waiting or being seen. The average patient therefore spends 18 / 12 = 1.5 hours in the clinic, though the clinical time with a nurse and a physician is about 20 minutes.
Little's law also shows what can and cannot be done. If Fairway wants to cut the time fresh produce spends between farm and shelf without reducing sales, it must cut the inventory in its supply chain. If Lakeview wants shorter visits at the same patient volume, it must reduce the number of patients waiting. Managers cannot reduce flow time at a given flow rate while holding the same inventory; the arithmetic forbids it.
The theory of constraints
Eliyahu Goldratt popularized the management of bottlenecks in his 1984 business novel The Goal, in which a plant manager saves his factory by finding and exploiting its constraints. Goldratt's theory of constraints offers five focusing steps. Identify the constraint. Decide how to exploit it, making sure it never stops for lack of work, never processes defective units and never wastes time on changeovers that could be avoided. Subordinate everything else to that decision, so that other steps work at the pace of the constraint rather than at their own maximum. Elevate the constraint by adding capacity if exploiting it is not enough. And when the constraint moves elsewhere, as it will, go back to the first step.
Two sayings from The Goal capture the logic. An hour lost at the bottleneck is an hour lost for the whole system, because nothing else can make it up. An hour saved at a non-bottleneck is a mirage, because that step already had idle time. For Northfield, the third welding cell would raise welding capacity from 480 to 720 an hour and change nothing else: output would stay at 400. The same money spent at the press might buy a quick-change die system that cuts the 50 minutes of changeover per shift to 10, raising the press's effective capacity, or a second, older press could take over the simplest parts. Daniel's team estimates that cutting changeovers alone would raise the press to about 440 an hour, at which point the welders would be close to their limit too, and the bottleneck would begin to shift.
# Capacity analysis of Northfield's bracket line
steps = [  # (name, parallel resources, seconds per unit)
    ('Blanking', 1, 6.0), ('Stamping press', 1, 9.0), ('Robot welding', 2, 15.0),
    ('Painting', 1, 7.2), ('Packing', 3, 20.0)]
demand = 450  # brackets per hour

def check_line(steps, demand):
    cap = {name: m * 3600 / p for name, m, p in steps}
    bottleneck = min(cap, key=cap.get)
    flow = min(demand, cap[bottleneck])
    for name in cap:
        print(f"{name:15} capacity {cap[name]:5.0f}/h  utilization {flow / cap[name]:4.0%}  implied {demand / cap[name]:5.1%}")
    print(f"Bottleneck: {bottleneck}; flow rate {flow:.0f}/h")
    return flow

flow = check_line(steps, demand)
wip = 5400
print(f"Little's law: flow time = {wip} / {flow:.0f} = {wip / flow:.1f} hours")
print(f"Takt time: {2 * 7.5 * 3600 / (demand * 15):.1f} s per unit; cycle time at the press: 9.0 s")

print("\nOption A: third welding cell")
check_line([s if s[0] != 'Robot welding' else ('Robot welding', 3, 15.0) for s in steps], demand)
print("\nOption B: quick die change lifts the press to 440 an hour")
check_line([s if s[0] != 'Stamping press' else ('Stamping press', 1, 3600 / 440) for s in steps], demand)Blanking capacity 600/h utilization 67% implied 75.0% Stamping press capacity 400/h utilization 100% implied 112.5% Robot welding capacity 480/h utilization 83% implied 93.8% Painting capacity 500/h utilization 80% implied 90.0% Packing capacity 540/h utilization 74% implied 83.3% Bottleneck: Stamping press; flow rate 400/h Little's law: flow time = 5400 / 400 = 13.5 hours Takt time: 8.0 s per unit; cycle time at the press: 9.0 s Option A: third welding cell Blanking capacity 600/h utilization 67% implied 75.0% Stamping press capacity 400/h utilization 100% implied 112.5% Robot welding capacity 720/h utilization 56% implied 62.5% Painting capacity 500/h utilization 80% implied 90.0% Packing capacity 540/h utilization 74% implied 83.3% Bottleneck: Stamping press; flow rate 400/h Option B: quick die change lifts the press to 440 an hour Blanking capacity 600/h utilization 73% implied 75.0% Stamping press capacity 440/h utilization 100% implied 102.3% Robot welding capacity 480/h utilization 92% implied 93.8% Painting capacity 500/h utilization 88% implied 90.0% Packing capacity 540/h utilization 81% implied 83.3% Bottleneck: Stamping press; flow rate 440/h
The output confirms the diagnosis. The third welding cell leaves throughput at 400 an hour and simply lowers the welders' utilization to 56 percent. Faster die changes raise throughput to 440, and the table shows that at that rate the welders become a near-bottleneck at 92 percent utilization. Daniel takes two conclusions back to the plant. The 1.2 million dollar welding cell should not be bought now. And the plant should measure output at the press and protect it, for example by keeping a small buffer of blanks in front of it so that it is never starved, scheduling maintenance outside production hours and inspecting blanks before, rather than after, they are pressed.
Worked problem
Lakeview's evening clinic
Patients at the evening clinic pass through registration (one clerk, 4 minutes per patient), triage (one nurse, 6 minutes), examination (two physicians, 9 minutes each) and discharge (one clerk, 3 minutes). About 12 patients an hour arrive between 6 and 10 p.m. Find the capacity of each step, the bottleneck, the utilization of each resource, and the effect of adding a third physician for the busiest two hours.
Show solution
- Capacities: registration 60/4 = 15 an hour; triage 60/6 = 10 an hour; examination 2 × 60/9 = 13.3 an hour; discharge 60/3 = 20 an hour.
- The bottleneck is triage, at 10 an hour, below demand of 12 an hour. Implied utilization of triage is 120 percent, so the queue in front of the triage nurse grows all evening.
- At a flow rate of 10 an hour, utilizations are registration 67 percent, triage 100 percent, examination 75 percent and discharge 50 percent.
- A third physician raises examination capacity to 20 an hour but leaves the flow rate at 10 an hour, set by triage. The right first move is to raise triage capacity, for example by having a second nurse triage during peak hours or by moving part of triage, such as taking vital signs, to the registration step.
Answer: Hana's staff had assumed the physicians were the constraint because patients complained of waiting to see a doctor. The analysis shows that patients waited mainly before triage. Adding a part-time second triage nurse from 6 to 9 p.m. would make examination the bottleneck at 13.3 an hour, above demand, so queues would stop growing.
Common mistakes
MistakeThe busiest-looking resource is the bottleneck.
InsteadThe bottleneck is the resource with the lowest capacity relative to its workload; others may look busy because work arrives in bursts.
MistakeAdding capacity anywhere raises output.
InsteadOnly added capacity at the bottleneck raises output; elsewhere it adds idle time.
MistakeFlow time is the sum of processing times.
InsteadFlow time includes waiting, which usually dominates; Little's law gives it from inventory and flow rate.
MistakeEvery step should run at full speed.
InsteadNon-bottleneck steps should be paced to the bottleneck; running them faster only builds inventory.
Summary and key terms
- A process flow diagram shows steps, buffers and resources; capacity of a resource is the number of parallel units divided by processing time.
- Process capacity is the capacity of the bottleneck; flow rate is the smaller of demand and capacity.
- Implied utilization, demand divided by capacity, identifies the bottleneck and can exceed 100 percent.
- Takt time is available time divided by demand; the process keeps up only if cycle time is no longer than takt time.
- Little's law, I = R × T, links inventory, flow rate and flow time in any stable process.
- The theory of constraints: identify, exploit, subordinate, elevate and repeat.
- Flow unit
- The item followed through a process, such as a part, a patient or a dollar of inventory.
- Bottleneck
- The resource with the lowest capacity, which limits the capacity of the whole process.
- Utilization
- Flow rate divided by capacity.
- Implied utilization
- Demand divided by capacity; above 100 percent means the resource cannot meet demand.
- Takt time
- Available time divided by demand: the pace needed to keep up with customers.
- Little's law
- Average inventory equals average flow rate times average flow time.
- Theory of constraints
- Goldratt's approach of managing a system through its constraint.
Practice problems
Work each problem on paper first, then reveal the answer to check.
A three-step process has one machine at 2 minutes per unit, two workers at 5 minutes each and one inspector at 3 minutes. What is the process capacity per hour, and which step is the bottleneck?
Show answer
Capacities: 30, 24 and 20 an hour. The inspector is the bottleneck at 20 an hour.
A call center handles 240 calls an hour and on average 40 callers are on hold or being served. What is the average time a caller spends in the system?
Show answer
T = I / R = 40 / 240 hours = 10 minutes.
A plant has 14 productive hours a day and demand of 840 units a day. What is the takt time?
Show answer
14 × 60 / 840 = 1 minute per unit.
A company holds 60 million dollars of inventory and has cost of goods sold of 360 million a year. What is the average flow time of a dollar of inventory, in days?
Show answer
T = 60 / 360 years = 1/6 year ≈ 61 days.
Lesson quiz · 5 questions
Score 60% or more to complete this lesson.
Create a free account to save your progress, take quizzes and earn a certificate.