
MBA-513 · Lesson 4 of 12 · 21 min
Quality management and statistical process control
In the second week of February, one of Northfield's automotive customers sends Daniel's plant a formal complaint. A batch of brackets arrived with mounting holes slightly too large, and the bolts that fasten them to the seat frame would not seat properly. The customer's assembly line stopped for forty minutes while the brackets were sorted, and the supplier scorecard that decides who keeps the business now shows Northfield in amber. The plant's inspectors had measured a sample of the batch before shipping, and every bracket they checked was within tolerance. Dr. Raman uses the complaint to open the lesson. Inspection, she says, tells you whether you made a bad part. It does not tell you that you are about to.
What quality means
Quality has more than one meaning, and managers who argue about it are often using different ones. David Garvin of Harvard listed eight dimensions in 1987: performance, the primary operating characteristics; features, the extras; reliability, the probability of failure over a period; conformance, meeting specifications; durability, the useful life; serviceability, the ease and speed of repair; aesthetics; and perceived quality, the reputation. Operations is most directly responsible for conformance and reliability, while design sets performance, features and durability. Lesson 1 drew the corresponding line between design quality and conformance quality. A Cedarline jacket can be designed to be waterproof for ten years, but if the seams are taped badly in one factory, that design quality never reaches the customer.
The cost of quality is a useful way to make the case for prevention. Armand Feigenbaum and Joseph Juran grouped quality costs into four categories. Prevention costs are spent to stop defects happening, such as training, process design and supplier development. Appraisal costs are spent to find defects, such as inspection and testing. Internal failure costs arise when defects are found before the customer receives the product: scrap, rework and the lost capacity they consume. External failure costs arise when the customer finds them: returns, warranty claims, recalls, penalties and lost business. External failures are almost always the most expensive, and the central lesson of the quality movement is that money moved from appraisal and failure into prevention usually reduces the total. Daniel's complaint will cost Northfield the sorting charge, the scorecard penalty and, if it recurs, a share of the next contract.
The quality movement
Modern quality management has three main roots. Walter Shewhart, a physicist at Bell Telephone Laboratories, invented the control chart in 1924 and argued that variation in any process has two kinds of causes. Common causes are the many small influences built into the process, such as minor differences in material, temperature and operator technique; they produce stable, predictable variation. Special causes, which W. Edwards Deming later also called assignable causes, are specific events outside the normal system, such as a worn tool, a new batch of steel or an untrained operator; they make the process unstable. Shewhart's insight was that the two require different responses. Special causes should be found and removed by the people closest to the process. Common-cause variation can be reduced only by changing the system itself, which is management's job.
Deming, who had worked with Shewhart, taught statistical quality methods to Japanese engineers and executives from 1950, and his ideas became central to the rise of Japanese manufacturing. His fourteen points for management included ceasing dependence on mass inspection, ending the practice of awarding business on price alone, driving out fear and breaking down barriers between departments. He also popularized the plan-do-study-act cycle, adapted from Shewhart, as the basic loop of improvement. Juran, who also lectured in Japan in the 1950s, emphasized quality planning and the Pareto principle that a vital few causes account for most problems. In the 1980s, after American and European firms lost market share to Japanese manufacturers with far lower defect rates, total quality management brought these ideas to the West.
Quality management systems are now often certified to ISO 9001, the international standard that requires documented processes, management review, corrective action and continual improvement. Most automotive customers require more: the IATF 16949 standard adds requirements specific to the auto industry, including statistical process control on characteristics that matter to the customer. Northfield holds both certifications, which is why the complaint alarms Daniel. Certification shows that a system exists. It does not guarantee that every process is in control.
Control charts
A control chart plots a statistic of a process, such as the mean of a small sample, against time, with a center line at its average and control limits usually placed three standard deviations above and below. When the process has only common-cause variation, almost all points fall within the limits in no particular pattern, and the process is said to be in statistical control. A point outside the limits, or a non-random pattern inside them, signals a probable special cause. Control limits are calculated from the process's own data. They are not specification limits, which describe what the customer requires. A process can be in control and still produce parts outside specifications if its common-cause variation is too wide, and it can be out of control while every part still meets specifications, as Northfield's process was at first.
For a measured characteristic such as a hole diameter, the usual pair is the x-bar chart for subgroup means and the R chart for subgroup ranges. The operator measures a small subgroup, often five consecutive parts, at regular intervals. With k subgroups, the center line of the x-bar chart is the grand mean of the subgroup means, and the average range R-bar estimates the spread. Tabulated constants convert R-bar into control limits. For subgroups of five, A2 is 0.577, D3 is 0 and D4 is 2.114, and the process standard deviation can be estimated as R-bar divided by d2 = 2.326.
Beyond single points outside the limits, the Western Electric rules, published in 1956 in a handbook from the company that ran Bell's factories, flag patterns that are unlikely under common-cause variation alone: two of three consecutive points beyond two standard deviations on the same side, four of five beyond one standard deviation on the same side, or eight consecutive points on one side of the center line. Each rule adds sensitivity at the cost of more false alarms, so plants choose a small set and apply it consistently.
For counts and proportions, attribute charts are used. The p chart plots the proportion of defective units in samples of size n. Its center line is the average proportion p-bar across samples, and its limits are p-bar plus or minus three times the square root of p-bar times one minus p-bar divided by n. The c chart plots the number of defects per unit, such as flaws per square meter of fabric. Hana's team uses a p chart for the proportion of emergency patients who leave without being seen, and Cedarline's quality team uses one for the proportion of defective jackets found when it inspects samples from each production lot.
Process capability
Control tells a manager whether a process is stable. Capability tells whether a stable process can meet specifications. The capability ratio Cp compares the width of the specification, the upper specification limit minus the lower, with six standard deviations of the process. A Cp of 1 means the process just fits within the specification if it is perfectly centered. Because processes are rarely perfectly centered, the index Cpk measures the distance from the process mean to the nearer specification limit, in units of three standard deviations. Automotive customers typically require a Cpk of at least 1.33 on important characteristics, which corresponds to the nearer limit lying four standard deviations from the mean; Six Sigma programs, the subject of lesson 6, aim for far more.
import random, math
rng = random.Random(513)

def diameter(shift):
    # hole diameter in mm: target 10.000, common-cause variation, plus any shift
    return 10.000 + shift + 0.012 * (sum(rng.random() for _ in range(12)) - 6)

# 20 subgroups of 5 brackets; a worn punch shifts the process from subgroup 17
groups = [[diameter(0.020 if g >= 16 else 0.0) for _ in range(5)] for g in range(20)]
base = groups[:15]                       # limits from the stable period
xbb = sum(sum(s) / 5 for s in base) / 15
rbar = sum(max(s) - min(s) for s in base) / 15
A2, D3, D4, d2 = 0.577, 0.0, 2.114, 2.326
ucl, lcl = xbb + A2 * rbar, xbb - A2 * rbar
print(f"Grand mean {xbb:.4f} mm, average range {rbar:.4f} mm")
print(f"x-bar limits {lcl:.4f} to {ucl:.4f}; R chart upper limit {D4 * rbar:.4f}")
for g, s in enumerate(groups, 1):
    xb, r = sum(s) / 5, max(s) - min(s)
    if g > 13:
        flag = '  OUT OF CONTROL' if not lcl <= xb <= ucl or r > D4 * rbar else ''
        print(f"Subgroup {g:2}: mean {xb:.4f}, range {r:.4f}{flag}")

sigma = rbar / d2
lsl, usl = 9.950, 10.050
print(f"Sigma {sigma:.4f} mm, Cp {(usl - lsl) / (6 * sigma):.2f}, "
      f"Cpk {min(usl - xbb, xbb - lsl) / (3 * sigma):.2f}")
m = xbb + 0.020
print(f"Cpk after the shift {min(usl - m, m - lsl) / (3 * sigma):.2f}")

# p chart for defective jackets in samples of 200 per lot
defects = [6, 4, 7, 5, 3, 6, 8, 5, 4, 15, 6, 5]
n = 200
pbar = sum(defects) / (n * len(defects))
half = 3 * math.sqrt(pbar * (1 - pbar) / n)
print(f"p chart: p-bar {pbar:.4f}, limits {max(0, pbar - half):.4f} to {pbar + half:.4f}")
print("Lots above the upper limit:", [i + 1 for i, d in enumerate(defects) if d / n > pbar + half])Grand mean 10.0017 mm, average range 0.0272 mm x-bar limits 9.9861 to 10.0174; R chart upper limit 0.0574 Subgroup 14: mean 9.9980, range 0.0398 Subgroup 15: mean 9.9995, range 0.0291 Subgroup 16: mean 10.0040, range 0.0189 Subgroup 17: mean 10.0194, range 0.0201 OUT OF CONTROL Subgroup 18: mean 10.0226, range 0.0296 OUT OF CONTROL Subgroup 19: mean 10.0225, range 0.0285 OUT OF CONTROL Subgroup 20: mean 10.0208, range 0.0191 OUT OF CONTROL Sigma 0.0117 mm, Cp 1.43, Cpk 1.38 Cpk after the shift 0.81 p chart: p-bar 0.0308, limits 0.0000 to 0.0675 Lots above the upper limit: [10]
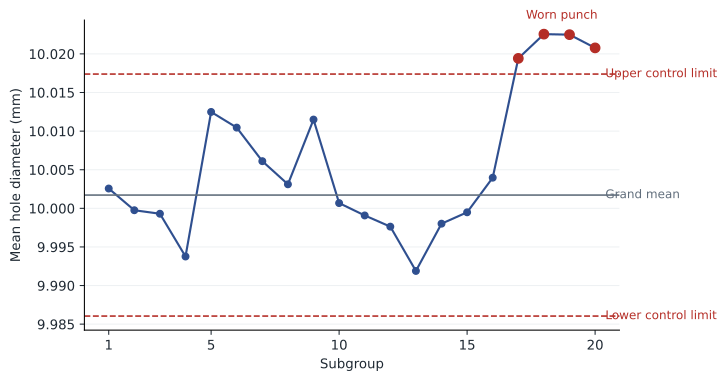
The output reconstructs what happened at Northfield. During the stable period, the hole diameter averaged 10.002 millimeters with a standard deviation of about 0.012, so the process was well within the specification of 10.00 plus or minus 0.05 and its Cpk of about 1.38 satisfied the customer's requirement. From subgroup 17, a worn punch shifted the mean up by about 0.02 millimeters. The four subgroups from 17 onward are all above the upper control limit, a clear signal of a special cause, although every individual part measured was still within specification. Had the operators been plotting the chart, they would have stopped the press and changed the punch within an hour of the shift. Instead, the shift continued, Cpk fell to about 0.81, and over the following days a growing share of parts drifted past the upper specification limit. The final sample inspection happened to miss them.
The p chart for Cedarline's inspections shows the same logic for attributes. Across twelve lots, about 3.1 percent of sampled jackets were defective, giving an upper control limit of about 6.7 percent. Lot 10, with 15 defective jackets out of 200, is above it, and the investigation found that the factory had brought in a new seam-taping machine without telling Cedarline. The other lots vary within the limits, and Dr. Raman warns against the common mistake of chasing each small rise or fall among them, which Deming called tampering: adjusting a stable process in response to common-cause variation only adds variation.
Prevention at the source
Statistical process control works best as part of a wider approach to building quality into a process. Shigeo Shingo, who worked with Toyota, developed poka-yoke, or mistake-proofing: designing a process so that an error is impossible or immediately obvious. A fixture that will not accept a part loaded backwards, a press that will not cycle unless both of the operator's hands are on the buttons, and a medication cabinet that opens only the drawer for the patient being treated are all poka-yoke. Source inspection, checking the conditions that cause defects rather than the defects themselves, moves inspection upstream. And giving workers authority to stop the line when they see a problem, a practice lesson 5 will describe at Toyota, ensures that problems surface while they are small. Daniel's corrective action plan uses all three: an x-bar chart at the press, a gauge that checks punch wear at each die change, and a rule that any operator may stop the press when a point falls outside the limits.
In the United States, the Malcolm Baldrige National Quality Award, created by Congress in 1987 and administered by the National Institute of Standards and Technology, recognizes organizations for performance excellence across business, health care, education and non-profit sectors. Hospitals such as Lakeview are also accredited by The Joint Commission, whose standards include quality and patient safety programs.
Worked problem
Is Lakeview's laboratory capable?
Lakeview's laboratory promises emergency physicians a result for a common blood test within 60 minutes of the sample arriving. Over a stable month, turnaround times averaged 41 minutes with a standard deviation of 7 minutes. There is no lower specification limit. Calculate the capability index, estimate the share of results that are late, and evaluate a proposal to cut the mean to 36 minutes by adding a courier run.
Show solution
- With only an upper limit, Cpk = (USL - mean) / 3σ = (60 - 41) / 21 = 0.90.
- The upper limit is (60 - 41) / 7 = 2.71 standard deviations above the mean. If turnaround times were roughly normal, about 0.3 percent of results would be late, but turnaround times are usually skewed to the right, so the true share is probably higher; the laboratory should count late results directly.
- With the mean at 36 and the same spread, Cpk = 24 / 21 = 1.14, and the limit is 3.4 standard deviations away.
- A larger gain may come from reducing variation: if the courier run also made arrivals more regular and the standard deviation fell to 5 minutes, Cpk at a mean of 36 would be 24 / 15 = 1.6.
Answer: The laboratory is in control but not very capable. Shifting the mean helps, but the bigger opportunity is to reduce variation, which will also make the process more predictable for physicians.
Common mistakes
MistakeInspection guarantees quality.
InsteadInspection finds some defects after they are made; control charts and mistake-proofing prevent them.
MistakeControl limits are the same as specification limits.
InsteadControl limits come from the process's own variation; specification limits come from the customer.
MistakeEvery rise in the defect rate should trigger an adjustment.
InsteadAdjusting a stable process for common-cause variation is tampering and increases variation.
MistakeA process within specification is in control.
InsteadA process can drift out of control while parts still meet specifications, as Northfield's did.
Summary and key terms
- Quality has several dimensions; operations is chiefly responsible for conformance and reliability.
- The cost of quality includes prevention, appraisal, internal failure and external failure; prevention usually lowers the total.
- Common-cause variation is built into the system; special causes are specific events that make a process unstable.
- Control charts signal special causes: x-bar and R charts for measurements, p and c charts for attributes.
- Cp and Cpk measure whether a stable process can meet specifications; Cpk accounts for centering.
- Mistake-proofing, source inspection and authority to stop the line build quality in.
- Cost of quality
- The sum of prevention, appraisal, internal failure and external failure costs.
- Common-cause variation
- Variation from the many small influences built into a stable process.
- Special cause
- A specific, identifiable event that makes a process unstable.
- Control chart
- A plot of a process statistic over time with a center line and control limits.
- Process capability
- The ability of a stable process to meet specifications, measured by Cp and Cpk.
- Tampering
- Adjusting a stable process in response to common-cause variation.
- Poka-yoke
- Mistake-proofing: designing a process so errors are impossible or obvious.
Practice problems
Work each problem on paper first, then reveal the answer to check.
Subgroups of 5 have a grand mean of 50.0 and an average range of 2.0. Find the x-bar chart limits.
Show answer
50.0 ± 0.577 × 2.0 = 48.85 to 51.15.
A process has specification limits 20 ± 0.6, a mean of 20.2 and a standard deviation of 0.15. Find Cp and Cpk.
Show answer
Cp = 1.2 / 0.9 = 1.33; Cpk = min(0.4, 0.8) / 0.45 = 0.89.
Samples of 400 invoices have an average error rate of 2 percent. What are the p chart limits?
Show answer
Standard error = √(0.02 × 0.98 / 400) = 0.007; limits 0 to 4.1 percent (the lower limit is negative, so it is set to 0).
Give one example of poka-yoke in a service.
Show answer
For example, an online form that will not accept a date of birth in the future, or a fuel nozzle that does not fit the wrong tank.
Lesson quiz · 5 questions
Score 60% or more to complete this lesson.
Create a free account to save your progress, take quizzes and earn a certificate.