
MATH-424 · Lesson 11 of 12 · 24 min
Conservation laws: diffusion and traffic flow
All the models so far have been lumped: one number for the whole lake, the whole city or the whole bus. Many questions depend on position as well as time. How fast does a dissolved pollutant spread along a narrow bay? Where does a traffic jam form behind a red light, and how fast does it move backward? Such questions need distributed models, whose state is a function of position and time and whose equations are partial differential equations. This lesson derives the most important family of such models from a single principle, conservation, and studies two members: the diffusion equation and the traffic flow equation.
Density, flux and conservation
Consider a quantity distributed along a line, such as the mass of a pollutant in a long narrow bay or the number of cars on a highway. Let \(u(x, t)\) be its density, the amount per unit length at position \(x\) and time \(t\), and let \(q(x, t)\) be its flux, the amount crossing position \(x\) per unit time in the positive direction. The amount in an interval \([a, b]\) is \(\int_a^b u\,dx\). If the quantity is neither created nor destroyed, it changes only because of what flows in at \(a\) and out at \(b\): \[\frac{d}{dt}\int_a^b u(x, t)\,dx = q(a, t) - q(b, t) = -\int_a^b \frac{\partial q}{\partial x}\,dx.\]
Since this holds for every interval, and the functions are assumed smooth, the integrands must be equal: \[\frac{\partial u}{\partial t} + \frac{\partial q}{\partial x} = 0.\] This is the conservation law in differential form. If the quantity is produced at a rate \(s(x, t)\) per unit length, for example by a source of pollution or by births in a population, the right side becomes \(s\). The conservation law is exact; it is one equation in two unknowns, \(u\) and \(q\). To close the model we need a constitutive relation expressing the flux in terms of the density. Different constitutive relations give different models, and choosing one is the modeling step.
Diffusion
For a substance spread by random molecular motion, or by small-scale turbulent mixing in water, the flux is from high concentration to low and, to a good approximation, proportional to the concentration gradient. This is Fick's law, \(q = -D\frac{\partial u}{\partial x}\), where \(D > 0\) is the diffusion coefficient, with units of length squared per time. Substituting into the conservation law gives the diffusion equation, also called the heat equation because Fourier's law of heat conduction has the same form: \[\frac{\partial u}{\partial t} = D\frac{\partial^2u}{\partial x^2}.\]
The equation says that \(u\) increases where its graph is concave up and decreases where it is concave down, so peaks are flattened and troughs filled. Dimensional analysis from lesson 2 already tells us the most important fact about it. The only combination of a length \(L\), a time \(t\) and \(D\) that is dimensionless is \(\frac{L^2}{Dt}\). So the distance over which diffusion spreads a substance in time \(t\) is of order \(\sqrt{Dt}\), and the time to spread over a distance \(L\) is of order \(\frac{L^2}{D}\). Doubling the distance quadruples the time. For a dissolved substance in still water, \(D \approx 10^{-9}\) m²/s, and spreading one meter would take about thirty years; in a bay, turbulent mixing gives effective values a million times larger, which is why spills spread over kilometers in days.
The spreading of a spill
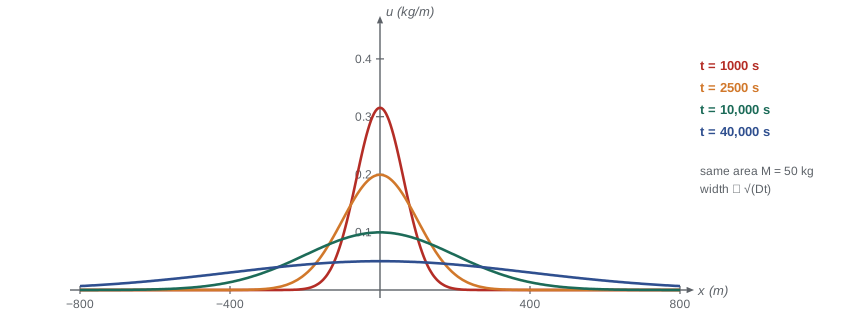
Suppose a mass \(M\) of a dissolved substance is released at \(x = 0\) in a long bay at \(t = 0\). The solution of the diffusion equation with this initial condition is the fundamental solution, \[u(x, t) = \frac{M}{\sqrt{4\pi Dt}}e^{-x^2/(4Dt)}.\] It is a normal density with mean 0 and variance \(2Dt\). Its integral over all \(x\) is \(M\) for every \(t\), as conservation requires; its peak height falls like \(\frac{1}{\sqrt{t}}\), and its width grows like \(\sqrt{t}\). The fundamental solution has the similarity form \(u = \frac{M}{\sqrt{Dt}}F(\frac{x}{\sqrt{Dt}})\), a direct consequence of the scaling argument above.
Worked problem
How far does the spill spread?
A spill of 50 kg of a dissolved substance is released at the middle of a long narrow bay with effective diffusion coefficient \(D = 2\) m²/s. After how long does the peak concentration fall below 0.1 kg/m, and how wide is the region above that level just before?
Show solution
- The peak is at \(x = 0\): \(u(0, t) = \frac{M}{\sqrt{4\pi Dt}} = \frac{50}{\sqrt{8\pi t}}\).
- Setting \(\frac{50}{\sqrt{8\pi t}} = 0.1\) gives \(\sqrt{8\pi t} = 500\), so \(t = \frac{250{,}000}{8\pi} \approx 9950\) s, about 2.8 hours.
- At that time the standard deviation of the profile is \(\sqrt{2Dt} = \sqrt{4 \times 9950} \approx 200\) m.
- Shortly before, the region above 0.1 kg/m is a narrow band around \(x = 0\); earlier still it is wider. For example at \(t = 2500\) s the level 0.1 is reached where \(e^{-x^2/(4Dt)} = \frac{0.1}{0.2} = 0.5\), that is \(|x| = \sqrt{4Dt\ln 2} \approx 118\) m.
Answer: After about 2.8 hours; the spill by then has spread with a standard deviation of about 200 m along the bay.
Separation of variables and decay of modes
On a finite interval \(0 < x < L\) with the ends held at zero, \(u(0, t) = u(L, t) = 0\), the diffusion equation can be solved by separation of variables. Trying \(u = X(x)T(t)\) gives \(\frac{T^\prime}{DT} = \frac{X^{\prime\prime}}{X} = -k^2\), a constant, with solutions \(X = \sin\frac{n\pi x}{L}\) and \(T = e^{-D(n\pi/L)^2t}\) for \(n = 1, 2, \dots\). The general solution is a Fourier sine series \[u(x, t) = \sum_{n=1}^\infty b_n\sin\frac{n\pi x}{L}e^{-D(n\pi/L)^2t},\] with coefficients \(b_n\) determined by the initial profile. Each mode decays at a rate proportional to \(n^2\), so fine-scale wiggles disappear almost instantly and the profile soon looks like the single slowest mode \(n = 1\), which decays on the time scale \(\frac{L^2}{\pi^2D}\). This explains the smoothing effect of diffusion in quantitative terms.
Computing solutions
The diffusion equation is also easy to solve numerically. On a grid \(x_j = j\Delta x\), \(t_m = m\Delta t\), replace the time derivative by a forward difference and the second space derivative by a centered difference: \[\frac{u_j^{m+1} - u_j^m}{\Delta t} = D\frac{u_{j+1}^m - 2u_j^m + u_{j-1}^m}{\Delta x^2}.\] With \(\lambda = \frac{D\Delta t}{\Delta x^2}\), this is \(u_j^{m+1} = \lambda u_{j-1}^m + (1 - 2\lambda)u_j^m + \lambda u_{j+1}^m\), the explicit scheme. It is stable only if \(\lambda \le \frac{1}{2}\). Above this limit, the highest-frequency mode is multiplied at each step by \(1 - 4\lambda < -1\) and grows explosively, with alternating signs, a direct analog of the unstable fixed point with \(F^\prime < -1\) in lesson 4. The restriction \(\Delta t \le \frac{\Delta x^2}{2D}\) means that halving the grid spacing requires quartering the time step, which is why implicit schemes, stable for every time step, are preferred for fine grids.
import math
D, L, nx = 1.0, 1.0, 51                    # scaled units
dx = L / (nx - 1)

def run(lam, t_end=0.05):
    dt = lam * dx * dx / D
    u = [math.sin(math.pi * j * dx) + 0.3 * math.sin(7 * math.pi * j * dx) for j in range(nx)]
    steps = round(t_end / dt)
    for _ in range(steps):
        u = [0.0] + [lam * u[j - 1] + (1 - 2 * lam) * u[j] + lam * u[j + 1] for j in range(1, nx - 1)] + [0.0]
    t = steps * dt
    exact = [math.sin(math.pi * j * dx) * math.exp(-math.pi**2 * D * t)
             + 0.3 * math.sin(7 * math.pi * j * dx) * math.exp(-49 * math.pi**2 * D * t) for j in range(nx)]
    return steps, max(abs(a - b) for a, b in zip(u, exact))

for lam in [0.25, 0.4, 0.5, 0.55, 0.6]:
    steps, err = run(lam)
print(f"lambda = {lam:4.2f}: {steps:4d} steps, max error {err:.2e}")lambda = 0.25: 500 steps, max error 4.96e-05 lambda = 0.40: 312 steps, max error 1.39e-04 lambda = 0.50: 250 steps, max error 1.98e-04 lambda = 0.55: 227 steps, max error 1.06e+01 lambda = 0.60: 208 steps, max error 8.90e+12
For \(\lambda \le \frac{1}{2}\) the computed solution matches the exact Fourier solution to a few parts in ten thousand or better. At \(\lambda = 0.55\) the error is already larger than the solution itself, and at 0.6 it is astronomical, even though the time step is only slightly larger: rounding errors excite the highest grid mode, which then grows at every step. Numerical stability is a property of the scheme, not of the equation, and checking it is part of solving any model numerically.
Traffic flow
Now apply the conservation law to cars on a single-lane road, with \(\rho(x, t)\) the density in cars per kilometer and \(q\) the flow in cars per hour. If cars travel at speed \(v\), then \(q = \rho v\). The constitutive assumption of the Lighthill–Whitham–Richards model, proposed in the 1950s, is that drivers adjust their speed to the local density: \(v = V(\rho)\), decreasing from the free speed \(v_{\max}\) on an empty road to zero at the jam density \(\rho_{\max}\), bumper to bumper. The simplest choice, due to Greenshields, is linear: \[V(\rho) = v_{\max}\Big(1 - \frac{\rho}{\rho_{\max}}\Big), \qquad q(\rho) = v_{\max}\rho\Big(1 - \frac{\rho}{\rho_{\max}}\Big).\] The conservation law \(\rho_t + q(\rho)_x = 0\) is now a nonlinear first-order equation.
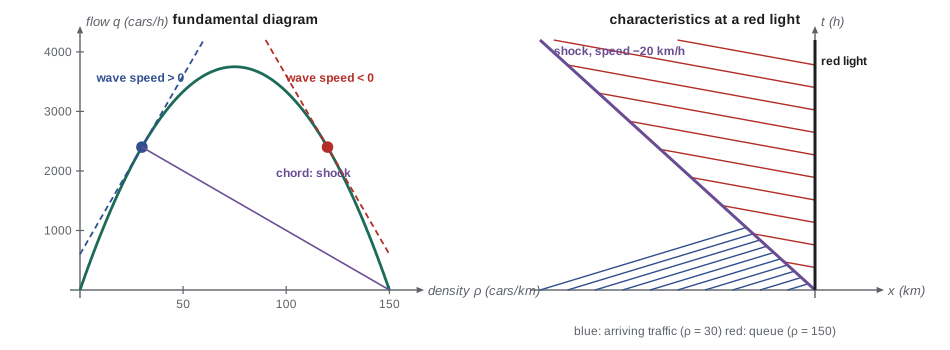
The graph of \(q\) against \(\rho\) is called the fundamental diagram. For the Greenshields law it is a parabola, the same shape as the logistic growth curve, with maximum flow \(q_{\max} = \frac{v_{\max}\rho_{\max}}{4}\) at the critical density \(\frac{\rho_{\max}}{2}\). For \(v_{\max} = 100\) km/h and \(\rho_{\max} = 150\) cars per km, the capacity of the lane is 3750 cars per hour, rather higher than the 2000 or so measured on real highways, which have fundamental diagrams with a sharper peak at lower density. The model's qualitative conclusions do not depend on these details.
Waves and shocks
Writing the conservation law as \(\rho_t + q^\prime(\rho)\rho_x = 0\) shows that density is carried along curves in the \((x, t)\) plane, called characteristics, with speed \[c(\rho) = q^\prime(\rho) = v_{\max}\Big(1 - \frac{2\rho}{\rho_{\max}}\Big).\] Along each characteristic \(\rho\) is constant, so the characteristics are straight lines. This wave speed is not the speed of the cars. In light traffic, \(\rho < \frac{\rho_{\max}}{2}\), waves move forward but slower than the cars. In heavy traffic waves move backward, against the traffic: this is why a disturbance on a busy highway, such as a driver braking, propagates backward as a stop-and-go wave that later drivers meet without ever seeing its cause.
When faster characteristics from behind catch up with slower ones ahead, they cross, and the solution would have several densities at one point. Physically, the density jumps abruptly: a shock forms. Conservation across the jump determines its speed. If the density jumps from \(\rho_1\) behind to \(\rho_2\) ahead, the shock speed is \[s = \frac{q(\rho_2) - q(\rho_1)}{\rho_2 - \rho_1},\] the slope of the chord of the fundamental diagram between the two states. For the Greenshields law this simplifies to \(s = v_{\max}(1 - \frac{\rho_1 + \rho_2}{\rho_{\max}})\).
Worked problem
The queue at a red light
Traffic with density \(\rho_1 = 30\) cars/km approaches a red light, behind which cars wait at the jam density 150 cars/km. With \(v_{\max} = 100\) km/h, how fast does the tail of the queue move back?
Show solution
- Upstream flow: \(q(30) = 100 \times 30 \times (1 - 0.2) = 2400\) cars/h. In the queue \(q(150) = 0\).
- Shock speed: \(s = \frac{0 - 2400}{150 - 30} = -20\) km/h.
- The tail of the queue moves backward at 20 km/h, about 5.6 m/s. During a 60-second red phase it grows to about 330 m, holding roughly 50 cars.
Answer: The tail moves back at 20 km/h; a one-minute red light builds a queue about a third of a kilometer long.
When the light turns green, the opposite happens: density drops from the jam value to lower values ahead, the characteristics fan out, and the queue dissolves in a rarefaction wave, with the front cars accelerating away and the start-up wave moving backward through the queue at the speed \(c(\rho_{\max}) = -v_{\max}\). The same mathematics describes bus bunching on a larger scale: a bus slowed by a dense cluster of waiting passengers behaves like a moving bottleneck, and the analysis of conservation laws helps transit planners design bus lanes and signal priority.
Other conservation laws
The pattern of this lesson, a conservation law plus a constitutive relation, generates a large part of applied mathematics. Adding diffusion to logistic growth gives Fisher's equation \(u_t = Du_{xx} + ru(1 - u)\), whose traveling waves spread at speed \(2\sqrt{rD}\) and describe the invasion of a new species, such as an invasive fish spreading up a river system. Conservation of mass and momentum for fluids gives the equations of hydraulics and of the atmosphere. Conservation of vehicles, combined with a different constitutive law, gives models of pedestrian crowds. In each case the art of modeling lies in the constitutive relation, which must be justified by mechanism and checked against data.
Common mistakes
MistakeTreating the wave speed in traffic as the speed of the cars.
InsteadWaves travel at \(q^\prime(\rho)\), which is less than \(V(\rho)\) and negative in heavy traffic.
MistakeExpecting diffusion to spread a substance at a constant speed.
InsteadSpreading distance grows like \(\sqrt{Dt}\); doubling the distance takes four times as long.
MistakeUsing the explicit scheme with a time step that is too large.
InsteadKeep \(\lambda = \frac{D\Delta t}{\Delta x^2} \le \frac{1}{2}\) or use an implicit scheme.
MistakeForgetting that the conservation law needs a constitutive relation.
InsteadThe law relates density and flux; a model such as Fick’s law or a speed–density relation is needed to close it.
Summary and key terms
- Conservation of a quantity with density \(u\) and flux \(q\) gives \(u_t + q_x = 0\), plus sources if any.
- Fick’s law \(q = -Du_x\) gives the diffusion equation \(u_t = Du_{xx}\); spreading distance scales like \(\sqrt{Dt}\).
- The fundamental solution is a normal density with variance \(2Dt\); Fourier modes decay at rates proportional to \(n^2\).
- The explicit scheme is stable only for \(\frac{D\Delta t}{\Delta x^2} \le \frac{1}{2}\).
- In the LWR traffic model \(q = \rho V(\rho)\); waves travel at \(q^\prime(\rho)\), backward in heavy traffic.
- Shocks move at the chord slope \(\frac{q(\rho_2) - q(\rho_1)}{\rho_2 - \rho_1}\); the tail of a queue moves backward.
- Flux
- The rate at which a quantity crosses a point, per unit time.
- Constitutive relation
- An assumed law linking flux to density, such as Fick’s law.
- Diffusion coefficient
- The constant D in Fick’s law, with units of length squared per time.
- Fundamental diagram
- The graph of traffic flow against density.
- Shock
- A moving jump in density whose speed is fixed by conservation.
Practice problems
Work each problem on paper first, then reveal the answer to check.
Estimate how long heat takes to diffuse through a 2 cm steak if \(D = 1.4 \times 10^{-7}\) m²/s, using \(t \sim \frac{L^2}{D}\) with \(L = 1\) cm.
Show answer
\(\frac{10^{-4}}{1.4 \times 10^{-7}} \approx 710\) s, about 12 minutes, a fair estimate of cooking time.
Verify that \(u = e^{-Dk^2t}\sin kx\) satisfies \(u_t = Du_{xx}\).
Show answer
\(u_t = -Dk^2u\) and \(u_{xx} = -k^2u\).
For the explicit scheme with \(D = 1\) and \(\Delta x = 0.01\), what is the largest stable time step?
Show answer
\(\Delta t \le \frac{0.0001}{2} = 5 \times 10^{-5}\).
In the Greenshields model with \(v_{\max} = 90\) km/h and \(\rho_{\max} = 120\) cars/km, find the capacity and the wave speed at density 90.
Show answer
\(q_{\max} = \frac{90 \times 120}{4} = 2700\) cars/h; \(c(90) = 90(1 - 1.5) = -45\) km/h.
Traffic at 20 cars/km meets slow traffic at 100 cars/km (Greenshields, \(v_{\max} = 100\), \(\rho_{\max} = 150\)). Find the shock speed.
Show answer
\(s = 100(1 - \frac{120}{150}) = 20\) km/h: the shock moves forward, slowly.
Lesson quiz · 5 questions
Score 60% or more to complete this lesson.
Create a free account to save your progress, take quizzes and earn a certificate.