
INS-410 · Lesson 7 of 12 · 28 min
Energy savings and payback
▶ Video coming soon A video version of this lesson is on the way.
Anika Varga's request to Coldstream had three columns: the energy each item saves, the money it saves and the time it takes to pay for itself. A fourth column, added by Kellerton's corporate office, asked for the carbon dioxide each item avoids. "Owners don't buy insulation," Raj told Priya. "They buy savings. Give them a number they trust and the job sells itself."
This lesson turns heat loss into money and emissions. It shows how to find the cost of steam from the price of fuel, how to work out annual savings, simple payback and return on investment, how to look further ahead with net present value, and how to estimate the carbon dioxide avoided. It also covers the traps that make savings estimates look better than they are.
From fuel to the cost of heat
A heat loss in watts or Btu per hour becomes a cost through three numbers: the hours per year at that loss, the efficiency with which the plant turns fuel into the heat that is lost, and the price of the fuel. For a steam system fired by natural gas:
Worked problem
The cost of Kellerton's steam
Natural gas is sold by the therm, 100,000 Btu of fuel energy. Kellerton's boilers turn about 80 in 100 of the fuel energy into steam, and the sample gas price is 1.10 dollars per therm. What does an MMBtu of steam cost?
Show solution
- Fuel per MMBtu of steam: 1 ÷ 0.80 = 1.25 MMBtu = 12.5 therms.
- Cost: 12.5 × 1.10 = 13.75 dollars per MMBtu of steam.
Answer: These are the sample prices used throughout INS-340 and this course. A real estimate uses the plant's own contract price, including delivery and other charges, and the boiler efficiency the plant measures.
Two refinements are common. Some audits use the system efficiency, which includes distribution losses and blowdown and is lower than the boiler's own efficiency, so the cost per unit of heat delivered is higher. And for cold systems, the energy is electricity for refrigeration, converted with the coefficient of performance from lesson 5.
Annual savings
The annual energy saving of an insulation project is the reduction in heat loss multiplied by the hours:
and the money saved is the energy saving times the cost of heat. Return to the bare 4 in line from lesson 2, at Kellerton's 7,550 full-pressure hours a year.
Worked problem
Savings from insulating the bare line
The 65 ft 4 in line lost 1,111 Btu/h·ft bare; with 3 in of mineral wool and aluminum jacket it loses 55.3 Btu/h·ft (lesson 2). Find the annual energy, gas and dollar savings.
Show solution
- Saving per foot: 1,111.1 − 55.3 = 1,055.8 Btu/h·ft; for 65.33 ft: 68,977 Btu/h.
- Energy: 68,977 × 7,550 ÷ 10⁶ = 520.8 MMBtu of steam a year.
- Fuel: 520.8 ÷ 0.80 = 651.0 MMBtu = 6,510 therms a year.
- Money: 520.8 × 13.75 = 7,161 dollars a year.
Answer: About 7,200 dollars a year from one forgotten line, the reason INS-120 used it as a warning and Kellerton changed its rules after the outage.
Simple payback and return
Simple payback is the installed cost divided by the annual saving: the number of years the savings take to repay the cost, ignoring interest. It is the measure most owners ask for first, and many plants have a rule of thumb, such as approving any energy project with a payback under two or three years without further study.
The simple return on investment is the reverse, the annual saving as a share of the cost. A project with a payback of two years returns 50 in 100 of its cost each year.
Worked problem
Payback on the bare line
Insulating the 65 ft 4 in line costs a sample 41 dollars per foot installed, about 2,679 dollars in all. Find the simple payback and the simple return.
Show solution
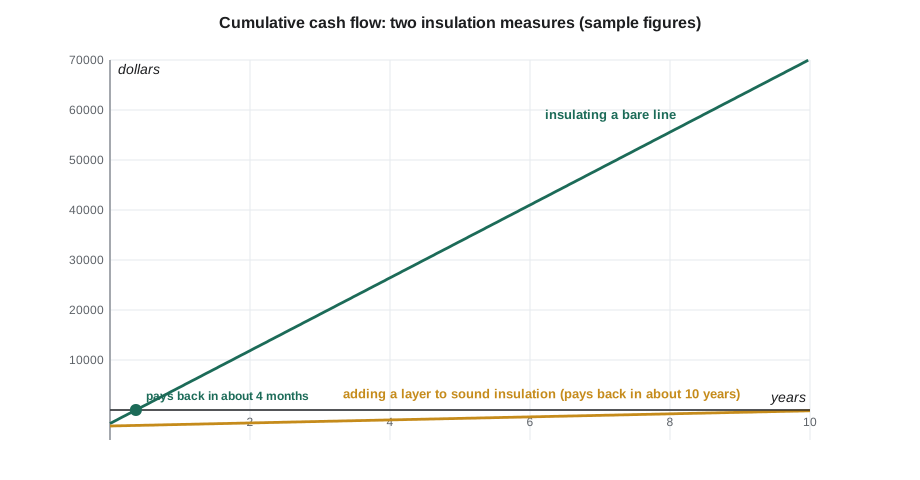
- Payback: 2,679 ÷ 7,161 = 0.37 years, about 4.5 months.
- Return: 7,161 ÷ 2,679 = 2.67, or 267 in 100 of the cost each year.
Answer: A payback of a few months is typical of insulating bare steam pipe, and is why bare steam lines and fittings head every audit list.
| Item | Typical simple payback on high-pressure steam |
|---|---|
| Bare steam pipe, insulated | a few months |
| Bare valves and flanges, with removable covers | one to two years, as INS-340 found (about 1.7 years for an 6 in valve cover) |
| Damaged or wet insulation, replaced | one to four years |
| Adding thickness to sound insulation | often ten years or more, as lesson 3 showed |
| Low-temperature hot water or condensate | longer than steam, because the temperature difference is smaller |
Looking further ahead
Simple payback ignores what happens after the cost is repaid. Two projects with the same payback may differ a lot in total value if one lasts five years and the other twenty. Larger owners therefore also use net present value (NPV): the present value of all the future savings, discounted at the owner's rate, minus the cost. For equal yearly savings over n years at rate i, the present value is the saving times an annuity factor:
With i = 0.08 and n = 10 years, the annuity factor is 6.710. For the bare line, the NPV over 10 years is 7,161 × 6.710 − 2,679 = 45,370 dollars. A positive NPV means the project earns more than the owner's rate; this one earns far more.
Carbon dioxide avoided
Burning less gas means emitting less carbon dioxide. The estimate multiplies the fuel saved by an emission factor:
- For natural gas, the US EPA's emission factor is about 53.06 kg of CO₂ per MMBtu of fuel burned, about 5.3 kg per therm.
- For electricity, the factor depends on how the local grid generates power and varies widely by province, state and year; use the figure the owner or utility gives.
Worked problem
Emissions avoided on the bare line
The insulated line saves 651.0 MMBtu of fuel a year. About how much CO₂ is avoided?
Show solution
- 651.0 × 53.06 = 34,540 kg, about 35 metric tons a year.
Answer: About 35 metric tons of CO₂ a year, roughly what seven or eight typical passenger cars emit in a year.
Kellerton's corporate office uses the CO₂ column to rank projects across its plants, and some utility incentive programs and corporate carbon targets reward them. Raj noted the factor he used and its source on each line, so that Anika could swap in her company's official figure.
Traps in savings estimates
Savings estimates are easy to inflate by accident, and an owner who is burned once by a contractor's optimistic numbers does not trust the next one. The common traps are:
- Wrong hours. Using 8,760 hours (every hour of the year) or the boiler hours when the line runs at temperature less often.
- Bare losses at the wrong conditions. Using an outdoor-wind bare loss for an indoor pipe, or a high emittance for a painted pipe, exaggerates the saving.
- Counting the same heat twice. If a heat recovery or a new valve cover is already planned for an item, do not count its saving again in the insulation list.
- Ignoring useful heat. Heat lost from pipes inside a heated building in winter partly warms the building. In boiler houses this is seldom useful, because they are already too hot, but in an office ceiling it may reduce the true saving. In summer, the same heat adds to the cooling load, which increases the saving.
- Incentives and real costs. A utility incentive reduces the owner's cost and shortens the payback, but it should be shown as a separate line, so the owner can see both.
Raj's rule for Anika's list: every saving is calculated with stated inputs, the bare losses match the conditions where the item actually is, and the hours are the plant's 7,550 full-pressure hours, not 8,760.
Savings on cold systems
On a refrigerated line, the saving from good insulation is electricity, priced at the plant's electricity rate and divided by the coefficient of performance, as lesson 5 showed. Wet insulation is where the big losses hide.
Worked problem
Drying out a wet suction line
A 100 ft run of suction main with 2 in of polyisocyanurate and PVC jacket gains 21.6 Btu/h·ft dry (lesson 5). Suppose an old run with a failed vapor retarder has wet insulation gaining about three times as much. Replacing it, with a COP of 1.8, 7,550 hours a year and a sample electricity price of 0.12 dollars per kWh, saves how much?
Show solution
- Heat gain saved: (3 × 21.59 − 21.59) × 100 = 43.18 × 100 = 4,318 Btu/h = 1.266 kW.
- Electricity: 1.266 ÷ 1.8 = 0.703 kW, over 7,550 h: 0.703 × 7,550 = 5,310 kWh a year.
- Money: 5,310 × 0.12 = 637 dollars a year.
Answer: Several hundred dollars a year from one run, before counting the corrosion and ice that wet insulation brings. On cold work the strongest argument for repair is usually the pipe, not the power, but the power saving helps the case.
How sure is the saving?
Every input to a savings estimate has some uncertainty, and the price of energy has the most. A simple way to show an owner how much it matters is a sensitivity table: the same estimate at lower and higher prices.
| Steam cost | Annual saving, bare line | Simple payback |
|---|---|---|
| 75 in 100 of the sample | 5,371 dollars | 6.0 months |
| The sample price | 7,161 dollars | 4.5 months |
| 125 in 100 of the sample | 8,951 dollars | 3.6 months |
| 150 in 100 of the sample | 10,742 dollars | 3.0 months |
For an item like a bare steam line, the answer does not change: it pays back in months at any reasonable price. For a marginal item, such as a thickness upgrade, a sensitivity table can show that the decision depends on the price, which is exactly what the owner needs to know.
Presenting savings
Raj's savings tables for owners follow a fixed layout, because a reader who sees the same format every time learns to trust it. Each row has the item, its location, the measure, the energy saved, the money saved, the installed cost, the simple payback and the CO₂ avoided. The first page states the inputs, hours, efficiency, prices and emission factors, and their sources. Totals appear at the bottom, with and without any item that is justified for reasons other than energy. Numbers are rounded to two or three significant figures, and ranges are given where an input is uncertain. Nothing is hidden in a footnote that changes the answer.
The aim is a table that someone who was not at the plant, such as an accountant in a head office, can read, check and act on. That is the test Kellerton's corporate office would apply to Anika's request.
Savings that are not energy
Some of the most important benefits of insulation work never appear in a savings column. Fixing a wet section stops corrosion under insulation and may save a pipe replacement. Covering a bare valve near a walkway removes a burn hazard. Insulating a steam line in a hot boiler house lowers the room temperature and makes summer work bearable. Restoring a vapor retarder stops ice building on an ammonia line, which is a safety issue as well as an energy one. A good proposal lists these benefits next to the energy savings, in words, so that an owner can weigh them. Raj's draft for Anika had a column headed "other reasons", and for some items it was the most important column on the page.
One last check before a savings table goes out: compare the total with the plant's fuel use. If the insulation savings come to a large share of everything the boilers burn, something is wrong, because bare surfaces are usually a few in 100 of a steam plant's fuel, not a third of it. Raj compared his Kellerton total with the plant's annual gas use, which Anika gave him, and found it a small fraction, as expected.
Common mistakes
MistakePricing heat at the fuel price without the boiler efficiency.
InsteadDivide by the efficiency; heat lost from steam costs more than the fuel's energy content.
MistakeUsing 8,760 hours for every line.
InsteadUse the hours the line is actually at temperature.
MistakeQuoting simple payback alone for long-life projects.
InsteadAdd NPV or life-cycle cost so owners can compare projects of different lives.
MistakeMixing fuel saved and steam saved in emissions estimates.
InsteadApply the emission factor to the fuel actually burned.
MistakeHiding incentives inside the price.
InsteadShow the installed cost and the incentive as separate lines.
Summary and key terms
- The cost of heat is the fuel price divided by the fuel energy and the efficiency; the sample price gives 13.75 dollars per MMBtu of steam.
- Annual saving = reduction in heat loss × hours × cost of heat; the bare 65 ft line saves about 7,200 dollars a year.
- Simple payback = installed cost ÷ annual saving; bare steam pipe pays back in months, valve covers in one to two years.
- NPV uses an annuity factor (6.710 for 8 in 100 over 10 years) to value savings over the life.
- CO₂ avoided = fuel saved × emission factor; savings estimates must use real hours and conditions and avoid double counting.
- Cost of heat
- The cost of one unit of useful heat, from the fuel price, fuel energy content and efficiency.
- Simple payback
- Installed cost divided by annual saving, in years, ignoring interest.
- Return on investment
- Annual saving as a share of the installed cost.
- Net present value
- The present value of future savings at the owner's discount rate, minus the cost.
- Annuity factor
- The present value of one dollar a year for a number of years at a given rate.
- Emission factor
- The mass of CO₂ released per unit of fuel or electricity used.
- System efficiency
- The share of fuel energy that reaches the point of use, including distribution losses.
Practice problems
Work each problem on paper first, then reveal the answer to check.
What does a MMBtu of Kellerton steam cost at the sample price?
Show answer
13.75 dollars.
A project costs 9,000 dollars and saves 6,000 dollars a year. What is its simple payback?
Show answer
1.5 years.
What is the annuity factor for 8 in 100 over 10 years?
Show answer
6.710.
Why should the bare loss used for an indoor pipe not come from an outdoor table?
Show answer
Wind raises outdoor losses, so an outdoor value exaggerates the indoor saving.
About how much CO₂ does the insulated bare line avoid each year?
Show answer
About 35 metric tons.
Lesson quiz · 5 questions
Score 60% or more to complete this lesson.
Create a free account to save your progress, take quizzes and earn a certificate.