
HSE-221 · Lesson 12 of 12 · 25 min
Monitoring, auditing, human factors and capstone: designing a permit system
A permit system that is never checked will decay. Shortcuts become habits, forms are filled in from memory, site visits shrink to a glance from the doorway, and nobody notices until something goes wrong. This final lesson explains how sites monitor and audit their permit systems, how human factors shape the way people use permits, which performance indicators are useful, and how to bring everything in the course together. It ends with a capstone in which you design a permit system for a mid-sized processing plant.
Levels of monitoring
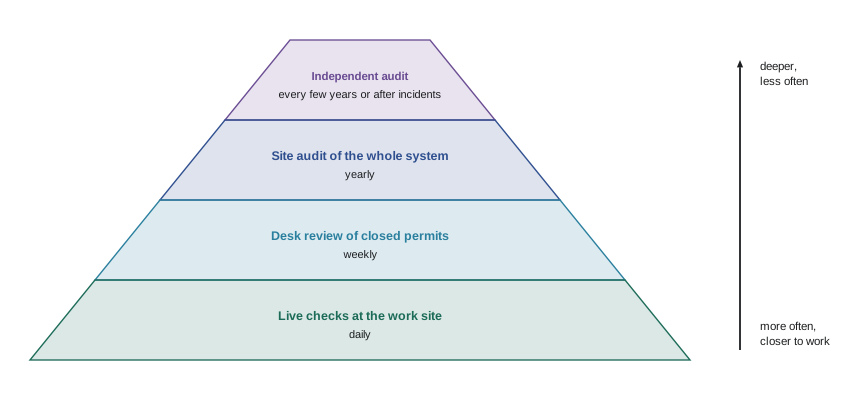
Effective sites check their permit systems at several levels, each with a different purpose:
- Live checks at the work site: supervisors, issuers and safety staff visit jobs in progress to confirm that the permit is displayed, the precautions are in place, the crew has been briefed and the work matches the scope. These checks catch problems while they can still be fixed.
- Desk reviews of closed permits: a sample of closed permits is reviewed for completeness, correct signatures, times, revalidations and linked certificates. Desk reviews are cheap but can only check what was written down.
- Periodic audits: a structured audit, at least yearly, examines the whole system: the procedure, training and authorization records, issuer workload, coordination meetings, conflict management, isolation practice, handover and the results of earlier checks. Audits should include field observation and interviews, not just paperwork.
- Independent audits: every few years, or after a serious incident, an audit by people from outside the site, such as corporate specialists or external consultants, brings a fresh view and helps avoid normalized shortcuts.
What to look for
HSG250 and industry guidance list common permit system failings that audits should look for:
- Permits issued without a joint site visit, or with signatures added afterwards.
- Vague job descriptions and generic precautions copied from earlier permits.
- Gas tests missing, out of date, or done at the wrong location or depth.
- Isolation certificates not linked to permits, or isolations removed while linked permits were live.
- Work outside the scope or location of the permit.
- Permits not displayed at the work site.
- Revalidations signed without a field check, or missing altogether.
- Crew members who cannot explain the hazards or precautions on the permit they signed.
- Issuers or holders without current authorization.
- Conflicts between permits that were not identified at coordination.
Sampling and compliance rates
Desk reviews and field checks usually look at a sample rather than every permit. The result is often expressed as a compliance rate: the percentage of sampled permits with no significant findings. Because it comes from a sample, the rate has some uncertainty. For a rough sense of that uncertainty, the standard error of a proportion is
where \( p \) is the observed compliance rate and \( n \) is the sample size. An approximate 95 percent confidence interval is \( p \pm 2 \times SE \). This is a simple approximation that works reasonably when the sample is not tiny and the rate is not very close to 0 or 100 percent.
Worked problem
How confident is a 78 percent compliance rate?
A site samples 50 closed permits in a month and finds that 39 have no significant findings. What is the compliance rate and an approximate 95 percent confidence interval? If the target is 90 percent, what can the site conclude?
Show solution
- Compliance rate: \( p = 39 / 50 = 0.78 \), or 78 percent.
- Standard error: \( SE = \sqrt{0.78 \times 0.22 / 50} = \sqrt{0.003432} \approx 0.059 \).
- Approximate interval: \( 0.78 \pm 2 \times 0.059 = 0.78 \pm 0.118 \), or about 66 to 90 percent.
- The whole interval lies at or below the 90 percent target, so the site can be fairly confident that true compliance is below target.
- The next step is to look at which findings were most common and fix their causes, rather than only reporting the number.
Answer: 78 percent, with an approximate interval of 66 to 90 percent; compliance is very likely below the 90 percent target.
Leading and lagging indicators
Permit performance can be tracked with indicators. Lagging indicators measure harm after it happens, such as incidents and near misses involving permitted work. They are important but too rare to guide day-to-day improvement. Leading indicators measure the health of the system before harm occurs. Useful leading indicators include:
- Percentage of field checks with no significant findings.
- Percentage of permits issued with a recorded joint site visit.
- Percentage of revalidations done on time with a retest.
- Number of conflicts identified and resolved at coordination meetings.
- Percentage of issuers and holders with current authorization.
- Average issuer workload during shutdowns compared with the planned maximum.
- Number of stop-work events raised under permits, which can be a sign of healthy challenge rather than a problem.
| Month | Field checks | Checks with no significant finding | Rate |
|---|---|---|---|
| January | 40 | 29 | 72.5 % |
| February | 42 | 32 | 76.2 % |
| March | 45 | 36 | 80.0 % |
| April | 44 | 38 | 86.4 % |
| May | 48 | 43 | 89.6 % |
Human factors
Most permit failures are not caused by people who do not care. They are caused by ordinary people working under time pressure, with unclear procedures, heavy workloads, poor forms and mixed messages from managers. Human factors research on permit systems points to several recurring themes:
- Production pressure: when schedules are tight, people feel pushed to issue permits quickly or start work before precautions are complete. Leaders must make it clear, by what they do as well as what they say, that permits come first.
- Normalization of deviance: small shortcuts that cause no immediate harm become accepted practice. Regular field checks and independent audits help detect them.
- Workload and fatigue: overloaded or tired issuers skip steps. Staffing plans must allow time for proper checks.
- Form design: long, cluttered forms encourage skimming; clear, logical forms support thinking.
- Communication: briefings, handovers and joint site visits are conversations. Plain language, checking understanding and encouraging questions all improve them, especially with contractors and workers whose first language differs from the site's.
- Just culture: people must be able to report mistakes and near misses without fear of unfair blame, while deliberate violations are still dealt with firmly.
Capstone: designing a permit system
Imagine you have been asked to design a permit system for a mid-sized food ingredients plant. The plant has a solvent extraction unit with hexane storage, a steam boiler house, a packaging hall, a wastewater treatment area with pits and tanks, and an electrical substation. It employs 180 people on three shifts and uses several maintenance contractors. Two major shutdowns are held each year. A good design would include the following elements, each drawn from a lesson in this course:
- Scope (Lesson 4): triggers for line breaking, hot work, confined space entry, excavation, live electrical work, work at height without collective protection, critical lifts and bypassing safety systems; any work by contractors in the extraction unit, boiler house or substation needs a permit; uncertain work defaults to a permit.
- Permit structure (Lesson 5): a main general permit with linked hot work, confined space, excavation and energized work certificates, an isolation certificate and gas test records, all cross-referenced.
- Roles and competence (Lesson 6): authorized issuers for each area, with an area authority for the extraction unit; authorized gas testers; contractor holders trained and assessed on the site procedure; an authorization register reviewed yearly.
- Life cycle and validity (Lesson 7): permits valid for one shift, revalidated at each shift change up to 14 shifts; hot work certificates valid for one shift only; all permits suspended on any alarm.
- Isolation (Lesson 8): positive isolation for all vessel entry and for hexane systems; double block and bleed for steam above a set pressure; group lockout boxes for multi-permit jobs; a long-term isolation register.
- Simultaneous operations (Lesson 9): a daily coordination meeting at 14:00, a plot plan board in the control room, and a conflict matrix that prohibits hot work within 15 meters of any hexane line break or tank opening.
- Handover (Lesson 10): written logs and 20-minute face-to-face overlap for issuers; walk-round of all isolations and overrides by the incoming area authority.
- Tools (Lesson 11): start with improved paper forms; evaluate an electronic system after one year, piloting in the extraction unit.
- Monitoring (Lesson 12): daily field checks on a sample of live permits, weekly desk reviews, a yearly site audit and an independent audit every three years; leading indicators reported monthly to the plant manager.
Legal links for the US plant would include OSHA 1910.146 for confined spaces, 1910.147 and 1910.333 for energy control, 1910.252 for hot work, NFPA 51B and NFPA 70E, and the process safety management standard if the quantity of flammable liquid in the extraction process makes it a covered process.
Learning from incidents and near misses
Every incident or near miss involving permitted work is an opportunity to improve the permit system. Investigations should ask not only what the individuals did, but why the system allowed it: Was the scope clear? Was the right permit type used? Were the precautions adequate? Was the isolation verified? Were conflicts identified? Was handover effective? Was the issuer overloaded? The answers should feed back into the procedure, forms, training and monitoring. Sharing lessons across sites and with industry associations multiplies their value, because the same failures appear again and again in different places.
Making the system better over time
A permit system is never finished. Plants change, people change and new hazards appear. The permit system owner should review the procedure at least every few years and after significant changes, using audit results, indicators, incident findings and feedback from issuers, holders and contractors. Small improvements, such as clearer forms, better coordination meeting agendas or extra issuers during shutdowns, often make the biggest difference.
Leadership and the permit system
Leaders set the tone for the permit system more than any procedure. When managers visit jobs and ask to see the permit, when they back people who stop work, when they make time and staff available for proper preparation, and when they treat audit findings as useful information rather than embarrassment, the permit system stays strong. When they push for speed, sign permits they have not checked or ignore repeated findings, people quickly learn that the permit is a formality. Including permit indicators in management reviews, and in the objectives of supervisors and managers, helps keep the system visible at every level.
When you complete the capstone, test your design against the failures described in Lesson 2. Would your system have caught the missing relief valve at Piper Alpha, the occupied trailers at Texas City, or two conflicting jobs on the same rack? If the honest answer is no, the design needs another look. A permit system is ultimately judged by the accidents it prevents, most of which nobody ever sees.
Every element in the design should have an owner and a review date, so that it is maintained after the designer moves on.
Common mistakes
MistakeRelying only on desk reviews of paperwork.
InsteadCombine field checks, desk reviews, site audits and independent audits.
MistakeReporting a compliance number without looking at causes.
InsteadAnalyze the most common findings and fix their causes.
MistakeTracking only incidents.
InsteadUse leading indicators such as field check results and site visit rates.
MistakeBlaming individuals for every permit failure.
InsteadLook for production pressure, workload, form design and other system causes, within a just culture.
MistakeDesigning a permit system by copying another site's forms.
InsteadDesign from your own hazards, people and operations, drawing on every element of the system.
Summary and key terms
- Permit systems need monitoring at several levels: field checks, desk reviews, site audits and independent audits.
- Audits should look for common failings such as missing site visits, vague scopes and unlinked isolations.
- Compliance rates from samples have uncertainty; approximate intervals help interpret them.
- Leading indicators track system health before harm occurs.
- Human factors such as production pressure, workload, form design and communication drive most failures.
- A just culture encourages reporting and challenge.
- A complete design brings together scope, structure, roles, life cycle, isolation, SIMOPS, handover, tools and monitoring.
- Field check
- An inspection of permitted work in progress at the job site.
- Desk review
- A paperwork review of closed permits.
- Independent audit
- An audit by people from outside the site.
- Compliance rate
- The percentage of sampled permits with no significant findings.
- Standard error
- A measure of uncertainty in a rate estimated from a sample.
- Leading indicator
- A measure of system health before harm occurs.
- Lagging indicator
- A measure of harm after it occurs, such as incidents.
- Normalization of deviance
- The gradual acceptance of shortcuts that have not yet caused harm.
- Just culture
- A culture that supports reporting while holding deliberate violations to account.
- Production pressure
- Pressure to complete work quickly that can push people to cut corners.
Practice problems
Work each problem on paper first, then reveal the answer to check.
Name four levels of permit system monitoring.
Show answer
Field checks, desk reviews, site audits, independent audits.
What can a desk review not detect?
Show answer
Whether precautions were actually in place in the field.
List four common permit failings.
Show answer
No site visit, vague scope, missing gas tests, unlinked isolations, work outside scope, missing revalidation.
30 of 40 sampled permits comply. What is the rate?
Show answer
75 percent.
For \( p = 0.75 \) and \( n = 40 \), what is the standard error?
Show answer
\( \sqrt{0.75 \times 0.25 / 40} \approx 0.068 \).
Give two leading indicators for a permit system.
Show answer
Field check compliance, site visit rate, on-time revalidations, authorization currency.
What is normalization of deviance?
Show answer
Gradual acceptance of shortcuts because they have not yet caused harm.
Why can a rising number of stop-work events be a good sign?
Show answer
It may show people feel able to challenge unsafe work.
What is a just culture?
Show answer
One that supports reporting of errors while still dealing firmly with deliberate violations.
Name five elements of a complete permit system design.
Show answer
Scope, permit structure, roles and competence, life cycle, isolation, SIMOPS, handover, tools, monitoring.
Lesson quiz · 5 questions
Score 60% or more to complete this lesson.
Create a free account to save your progress, take quizzes and earn a certificate.