
HSE-106 · Lesson 2 of 12 · 27 min
The scale and cost of slips, trips and falls
Slips, trips and falls are not rare events. Every year they injure tens of thousands of workers, cost employers billions in compensation, lost productivity and replacement staff, and kill hundreds of people at work. Yet because individual falls often seem minor and unremarkable, the overall problem is easy to underestimate. This lesson looks at what the statistics show, how injury rates are calculated, and how to estimate what a fall really costs an organization. Understanding the numbers helps safety practitioners make the case for prevention and target effort where it will do the most good.
Statistics change every year, and different agencies count injuries differently. The figures in this lesson come from published sources available in 2026 and are rounded. Always check the latest data from the relevant agency when you need an exact figure for a report.
What the US data show
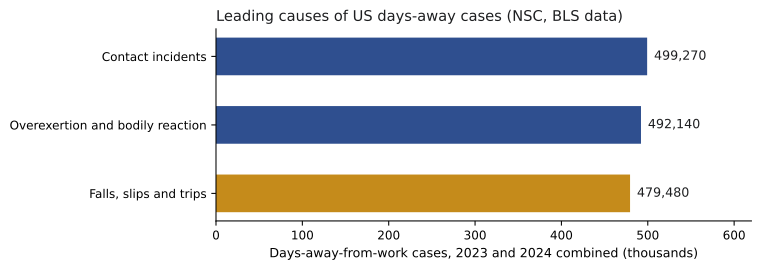
In the United States, the Bureau of Labor Statistics (BLS) publishes two main series. The Census of Fatal Occupational Injuries (CFOI) counts every work-related death; the Survey of Occupational Injuries and Illnesses (SOII) estimates nonfatal injuries from employer records. In 2024, CFOI recorded 5,070 fatal work injuries, of which 844, about one in six, were falls, slips and trips; that was down from 885 in 2023. About 10.8 percent of the fatal falls in 2024 were from heights of more than 30 feet, which means the great majority were from lower heights. For nonfatal injuries, the National Safety Council, using BLS data for 2023 to 2024, reports 479,480 cases involving days away from work caused by falls, slips and trips over the two years, making it the third leading cause after contact incidents and overexertion.
Most fatal falls are to a lower level, from ladders, roofs, scaffolds, stairs, vehicles and other elevations. But same-level falls also kill workers every year, especially older workers who hit their heads. Construction has the largest number of fatal falls, while health care, retail, transportation and warehousing, food services and building services report very large numbers of nonfatal same-level falls. OSHA has listed fall protection in construction as its most frequently cited standard for many years in a row, and ladder and general industry walking-working surface rules regularly appear on its top ten list.
Who gets hurt
Same-level slips and trips affect almost every occupation, but some sectors stand out. Health care workers walk long distances, handle patients and work on floors that are frequently cleaned or contaminated with fluids. Food service and kitchen workers deal with grease, water and food waste. Retail and warehouse workers move stock and work near loading docks and entrances. Cleaners and custodial staff work on floors while they are wet. Delivery drivers and postal workers face icy steps, driveways and vehicle steps in winter. Construction workers deal with uneven ground, debris, temporary stairs and ladders. Office workers are not immune: cables, open drawers, stairs and wet entrances in winter all cause falls.
Age matters too. Older workers are not necessarily more likely to slip, but they are more likely to be seriously injured and to need longer to recover when they fall. With an aging workforce in both Canada and the United States, fall prevention becomes more important each year. Young and new workers, on the other hand, may not yet recognize hazards and may hurry or take shortcuts.
Season matters in colder climates. Claims for falls on ice and snow rise sharply from November to March, and many of these falls happen in parking lots, on sidewalks and steps outside buildings, and at entrances where snow and water are tracked in. Lesson 9 covers winter hazards.
Measuring injury rates
Raw counts of injuries are hard to compare between sites of different sizes. Injury rates standardize the count by the amount of work done. The most widely used approach in North America calculates the number of cases per 100 full-time workers per year, using 200,000 hours (100 workers × 40 hours × 50 weeks) as the base.
Here \( N \) is the number of cases of the type being counted and \( H \) is the total hours worked by all employees during the period. The same formula gives a total recordable incident rate, a lost-time injury rate or a slip, trip and fall rate depending on which cases are counted. Some organizations use 1,000,000 hours as the base instead, which gives a number five times larger, so always check the base before comparing.
OSHA recordkeeping (29 CFR 1904) uses the 200,000-hour base for the total recordable case (TRC) rate and the days away, restricted or transferred (DART) rate, and BLS publishes industry averages on the same basis, which lets employers compare their performance to their industry.
Worked problem
Calculating a slip, trip and fall rate
A distribution center with 320 employees worked 652,000 hours last year. It had 9 injuries from slips, trips and falls, of which 5 led to time away from work. Calculate the slip, trip and fall injury rate and the lost-time rate for these injuries.
Show solution
- All slip, trip and fall injuries: \( 9 \times 200\,000 \div 652\,000 \approx 2.76 \) per 100 full-time workers.
- Lost-time slip, trip and fall injuries: \( 5 \times 200\,000 \div 652\,000 \approx 1.53 \) per 100 full-time workers.
- Check the base: 652,000 hours is about 326 full-time workers, consistent with 320 employees with some overtime.
- Compare with previous years and with the industry average to judge whether performance is improving.
Answer: About 2.8 slip, trip and fall injuries and 1.5 lost-time slip, trip and fall injuries per 100 full-time workers per year.
Leading and lagging indicators
Injury rates are lagging indicators: they measure harm after it has happened. They are important, but they move slowly, especially at small sites where one or two injuries can swing the rate dramatically. Leading indicators measure the activities and conditions that prevent injuries, and they give earlier warning. Useful leading indicators for slips, trips and falls include the percentage of scheduled floor inspections completed, the number of hazards reported and the average time to correct them, the number of near misses reported, the proportion of workers wearing suitable footwear in audits, the results of slip resistance testing over time, the percentage of spill kits stocked when checked, and the time taken to clear snow and ice after a storm. A rise in near-miss reports is often a good sign, showing that workers trust the system enough to report.
What a fall really costs
The direct costs of a fall are those paid through workers' compensation insurance: medical costs and indemnity payments for lost wages, and for serious injuries, permanent disability benefits. These costs flow back to the employer through premiums, which are adjusted by the experience modification rate (EMR). The 2025 Liberty Mutual Workplace Safety Index, based on 2022 data, estimated that falls on the same level cost US employers about $10.5 billion a year in direct costs, the second most costly cause of serious workplace injuries.
The indirect costs are usually larger than the direct costs, although they are harder to measure. They include time spent by supervisors and co-workers helping the injured worker, investigating and reporting; overtime or temporary staff to cover the absence; training a replacement; lost production and delayed orders; damage to products or equipment; administrative time managing the claim and the return to work; legal costs if a visitor or contractor is involved; and the effect on morale. Estimates of the ratio of indirect to direct costs vary widely, from about 1:1 to more than 4:1, depending on the organization and the method used.
| Cost type | Examples |
|---|---|
| Direct (insured) | Medical and rehabilitation costs, wage loss benefits, permanent impairment awards |
| Premium effects | Higher assessment or insurance rates through experience rating |
| Indirect (uninsured) | Supervisor and co-worker time, investigation, replacement workers, overtime, training |
| Production | Lost output, delays, overtime to catch up, damaged goods |
| Liability | Claims from visitors, customers or contractors injured on the premises |
| Intangible | Morale, reputation, recruitment and retention |
Worked problem
How much revenue does a fall wipe out?
A retailer has a profit margin of 4 percent. A customer service worker slips on a wet entrance floor and breaks a wrist. The direct claim cost is $28,000 and the company estimates indirect costs at 1.5 times the direct cost. How much extra revenue is needed to pay for this one injury?
Show solution
- Indirect cost: \( 1.5 \times 28\,000 = 42\,000 \) dollars.
- Total cost: \( 28\,000 + 42\,000 = 70\,000 \) dollars.
- Revenue needed at a 4 percent margin: \( 70\,000 \div 0.04 = 1\,750\,000 \) dollars.
- Compare: a full entrance matting system and a winter mat service might cost a few thousand dollars a year.
Answer: About $1.75 million in additional sales would be needed to recover the cost of one fall, which shows why prevention pays.
Using the numbers well
Statistics are most useful when they lead to action. A site can analyze its own incident and near-miss data to find where, when and how people fall: which areas, which shifts, which tasks, which seasons and which conditions. Patterns often appear quickly, such as falls clustered at one entrance in winter, near one dishwashing station or on one stairway. Mapping incidents on a floor plan, sometimes called a heat map, is a simple and powerful technique. The national figures help make the case to management, but local data show where to act.
Be cautious about drawing conclusions from small numbers. A site with two falls last year and four this year has not necessarily become twice as dangerous; random variation is large when counts are small. Look at trends over several years, combine injuries with near misses and hazard reports, and focus on the conditions that keep appearing.
Underreporting and data quality
Official statistics only capture the injuries that are reported and accepted. Many slips and trips that cause bruises, minor sprains or a few hours of discomfort are never reported, and some workers avoid reporting injuries because they fear blame, do not want to lose bonuses tied to injury-free records, or think the injury is too minor to matter. Incentive programs that reward low injury counts can unintentionally discourage reporting, which is why safety professionals now prefer programs that reward hazard reporting and participation instead. Undercounting matters because each unreported slip is a missed chance to find and fix a hazard before it causes a more serious injury.
Data quality also depends on how incidents are coded. A worker who slips on ice while carrying a box may be coded as a fall, an overexertion or a struck-by event depending on who completes the form. When analyzing your own data, read the incident descriptions rather than relying only on codes, and use consistent definitions from year to year so that trends are meaningful.
Benchmarking against others
Comparing a site's rates with industry averages helps put performance in context, but comparisons must be fair. Use the same type of case (for example lost-time slip, trip and fall injuries), the same hour base and the same time period, and compare with an industry that does similar work. A hospital should compare itself with other hospitals, not with offices. Benchmarking is most useful when combined with sharing practices: sites with low rates can often explain which controls made the difference, such as a winter maintenance contract with strict response times or a footwear program in kitchens.
Common mistakes
MistakeAssuming falls are a minor share of injuries.
InsteadFalls are consistently among the top three causes of lost-time injuries.
MistakeComparing rates calculated with different hour bases.
InsteadCheck whether 200,000 or 1,000,000 hours was used before comparing.
MistakeCounting only the compensation claim cost.
InsteadInclude indirect costs, which are often as large or larger.
MistakeRelying only on lagging injury rates.
InsteadTrack leading indicators such as inspections, hazard reports and near misses.
MistakeReading too much into small year-to-year changes.
InsteadLook at trends over several years and at patterns in location and cause.
Summary and key terms
- Falls are among the top three causes of lost-time injuries in Canada and the US.
- Most fatal falls are to a lower level, often from modest heights.
- Health care, food service, retail, warehousing, cleaning and construction are high-risk sectors.
- Rates standardize counts: cases × 200,000 ÷ hours worked.
- Leading indicators give earlier warning than injury rates.
- Indirect costs often equal or exceed direct compensation costs.
- Local incident and near-miss data show where to focus prevention.
- Lost-time injury
- Injury that keeps a worker away from work beyond the day of injury.
- Incident rate
- Cases per 100 full-time workers per year, using 200,000 hours.
- Lagging indicator
- Measure of harm that has already occurred.
- Leading indicator
- Measure of preventive activities or conditions.
- Direct cost
- Insured costs such as medical care and wage loss benefits.
- Indirect cost
- Uninsured costs such as lost time, replacement and production losses.
- Experience rating
- Adjustment of premiums based on an employer's claims history.
- Near miss
- Event that could have caused injury but did not.
- Heat map
- Floor plan marked with the locations of incidents and hazards.
- Profit margin
- Share of revenue left as profit after costs.
Practice problems
Work each problem on paper first, then reveal the answer to check.
Roughly what share of lost-time injuries are falls?
Show answer
About one in five or six.
What base is used for incident rates in North America?
Show answer
200,000 hours (100 full-time workers for a year).
A site has 4 cases in 250,000 hours. What is the rate?
Show answer
3.2 per 100 full-time workers.
Give two leading indicators for slips, trips and falls.
Show answer
Inspections completed, hazards reported and fixed, near misses reported.
Name three indirect costs of a fall.
Show answer
Supervisor time, replacement workers, lost production, investigation.
At a 5 percent margin, how much revenue covers a $50,000 loss?
Show answer
$1,000,000.
Why might older workers have worse outcomes from falls?
Show answer
They are more likely to be seriously injured and take longer to recover.
When do ice and snow fall claims peak?
Show answer
In winter months, roughly November to March.
What does a heat map show?
Show answer
Where incidents and hazards cluster on a site plan.
Is a rise in near-miss reports always bad?
Show answer
No, it often shows workers trust the reporting system.
Lesson quiz · 5 questions
Score 60% or more to complete this lesson.
Create a free account to save your progress, take quizzes and earn a certificate.