
GEOM-420 · Lesson 9 of 12 · 21 min
Deformation monitoring
Every structure moves a little. Dams settle and lean under the water they hold back, slopes creep, bridges sag under load and rise with the sun, and the ground around an excavation heaves and settles as soil is removed and water is pumped. Most of these movements are small and expected. Deformation monitoring measures them, repeatedly and precisely, so that engineers can tell the expected from the unexpected early enough to act. It is the most demanding kind of engineering survey statistically, because the question is not where a point is, but whether it has really moved, by an amount that may be close to the measurement error.
The headworks project has two monitoring needs. The diversion dam, an earthfill embankment with a concrete gate structure, must be monitored during and after the rebuild, as the district's dam safety obligations under Montana's dam safety program and the federal guidelines that owners and regulators use require. And the ground around the siphon's launch shaft and the pump station's excavation must be watched for settlement during construction, to protect the canal lining and the old gate structure nearby.
Designing a monitoring network
A monitoring network has two kinds of points. Reference points are placed where they will not move: on bedrock or deep foundations, well away from the structure and the area of influence of the excavation. Object points, or targets, are placed on the structure or the ground to be monitored: prisms on the gate structure's piers and walls, settlement monuments along the dam crest, and survey nails along the canal lining near the excavation. The network is measured from the reference points to the object points, and also between reference points, so that the stability of the references themselves can be checked.
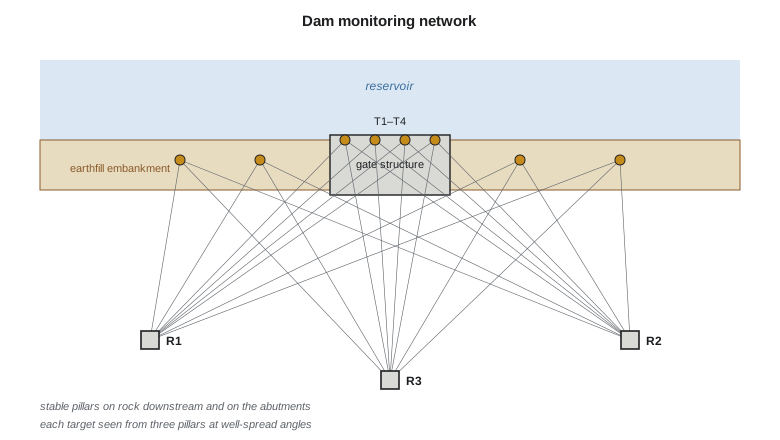
Reference pillars are reinforced concrete columns founded below frost depth, with forced-centering plates on top so that the instrument goes back to exactly the same position each time. The geometry must be good: each target should be seen from at least two, and preferably three, pillars at well-spread angles, so that its position is determined strongly in every direction. Before the first measurement, Theo simulates the network: he computes the expected standard deviations of each target from the planned observations and their precisions, using the least-squares design methods of GEOM-220, and moves or adds pillars until every target meets the required precision.
The required precision comes from the engineering. If the engineers want to detect movements of 5 mm, the measurement must determine each point to about 1 to 1.5 mm, because the test for movement compares two epochs, each with its own error. A network that measures to 3 mm cannot reliably detect 5 mm of movement. The monitoring plan sets out the movements of concern, the precision needed, the measurement frequency, and the actions at each alert level.
Measuring an epoch
Each complete set of measurements is an epoch. For the dam, the crew measures the network once a month during construction and after the first filling, then quarterly once movements settle down. Every epoch uses the same pillars, the same instruments (calibrated and checked), the same targets, and the same observing procedure, so that differences between epochs reflect movement, not changes in method. The crew observes early in the morning when refraction is most stable, records temperature and pressure for the distance corrections, and measures each target in both faces with several sets.
Automated systems are increasingly common. A robotic total station in a protected shelter on one pillar can measure the targets every hour, send the data by radio, and process it automatically. That gives far more information about how the structure behaves through the day and the seasons, and it catches sudden events quickly. It also produces large amounts of data with their own artifacts, such as daily thermal cycles in the instrument shelter and refraction changes over the reservoir, and someone must look at them with an engineer's eye.
Computing positions and testing movement
Each epoch is adjusted by least squares, with the reference points held fixed or, better, with the stability of the references tested first. The result for each target is its coordinates and their covariance matrix. Movement between two epochs is the difference in coordinates, and its covariance is the sum of the two covariances, assuming the epochs are independent. Whether the movement is significant is tested by comparing it with its covariance: the quadratic form of the displacement with the inverse covariance follows a chi-square distribution with two degrees of freedom in plan if there is no real movement.
The code applies this to one target, T4, on the gate structure. It is located from the three pillars by distances only, an over-determined trilateration with one redundant observation, in two epochs a month apart.
import math
# Headworks monitoring: locate target T4 from three stable pillars by least squares, two epochs, then test the movement
P = {'R1': (0.000, 0.000), 'R2': (180.000, 0.000), 'R3': (90.000, 140.000)}   # pillar coordinates, m
sig = 0.0008                                          # distance sigma, m (0.8 mm)
epochs = {1: {'R1': 109.4664, 'R2': 103.4105, 'R3': 76.4227},
          2: {'R1': 109.4704, 'R2': 103.4117, 'R3': 76.4182}}
def solve(obs):
    x = [95.0, 70.0]                                  # starting guess
    for _ in range(10):
        N = [[0.0, 0.0], [0.0, 0.0]]; t = [0.0, 0.0]
        for k, d in obs.items():
            px, py = P[k]; dx, dy = x[0] - px, x[1] - py; r = math.hypot(dx, dy)
            a = (dx / r, dy / r); w = d - r                # design row and misclosure
            for i in range(2):
                t[i] += a[i] * w
                for j in range(2): N[i][j] += a[i] * a[j]
        det = N[0][0] * N[1][1] - N[0][1] * N[1][0]
        Qi = [[N[1][1] / det, -N[0][1] / det], [-N[1][0] / det, N[0][0] / det]]
        dxv = [Qi[0][0] * t[0] + Qi[0][1] * t[1], Qi[1][0] * t[0] + Qi[1][1] * t[1]]
        x = [x[0] + dxv[0], x[1] + dxv[1]]
        if math.hypot(*dxv) < 1e-7: break
    return x, [[q * sig * sig for q in row] for row in Qi]
(x1, C1), (x2, C2) = solve(epochs[1]), solve(epochs[2])
for e, (x, C) in ((1, (x1, C1)), (2, (x2, C2))):
    print(f"epoch {e}: T4 E {x[0]:.4f} N {x[1]:.4f}  sigma E {1000*math.sqrt(C[0][0]):.2f} mm, N {1000*math.sqrt(C[1][1]):.2f} mm")
d = [x2[0] - x1[0], x2[1] - x1[1]]
Cd = [[C1[i][j] + C2[i][j] for j in range(2)] for i in range(2)]
det = Cd[0][0] * Cd[1][1] - Cd[0][1] * Cd[1][0]
Ci = [[Cd[1][1] / det, -Cd[0][1] / det], [-Cd[1][0] / det, Cd[0][0] / det]]
T = sum(d[i] * Ci[i][j] * d[j] for i in range(2) for j in range(2))
print(f"displacement dE {1000*d[0]:+.2f} mm, dN {1000*d[1]:+.2f} mm, total {1000*math.hypot(*d):.2f} mm")
print(f"test statistic {T:.1f} vs 5.99 (chi-square, 2 df, 95 %): {'significant movement' if T > 5.99 else 'no significant movement'}")epoch 1: T4 E 93.5388 N 61.0386 sigma E 0.68 mm, N 0.63 mm epoch 2: T4 E 93.5405 N 61.0431 sigma E 0.68 mm, N 0.63 mm displacement dE +1.70 mm, dN +4.50 mm, total 4.81 mm test statistic 28.2 vs 5.99 (chi-square, 2 df, 95 %): significant movement
The adjustment gives T4's position to about 0.7 mm in each coordinate in each epoch. Between the epochs it moved 1.70 mm east and 4.50 mm north, 4.81 mm in total. The test statistic is 28.2, far above the critical value of 5.99, so the movement is significant: it is not measurement noise. North, on this site, is downstream. A gate pier moving 4.8 mm downstream in a month during the first filling of the rebuilt reservoir is the kind of movement the engineers expect, but they will compare it with the predicted behavior, check the other targets for a consistent pattern, and watch the next epoch closely.
The test answers only the statistical question: is it real? Whether the movement matters is an engineering question. The monitoring plan sets alert and alarm levels for each type of point, usually as movements or rates beyond which the engineers must review, investigate or act. The surveyor's job is to deliver movements with their reliability, promptly, and to flag anything that exceeds a level or looks unusual, even if it is below a level.
Worked problem
A simple one-dimensional test
A settlement monument's height is measured as 912.4562 in one epoch and 912.4521 in the next, each with a standard deviation of 1.0 mm. Is the 4.1 mm settlement significant at 95 %?
Show solution
- \[\sigma_d = \sqrt{1.0^2 + 1.0^2} = 1.41\ \text{mm}\]
- \[z = 4.1 / 1.41 = 2.90 > 1.96\]
Answer: Yes. The settlement is about 2.9 times its standard deviation, well beyond the 95 % limit.
Are the references stable?
The whole analysis rests on the reference points not moving. If a pillar has moved, every target measured from it will appear to have moved, and the pattern can fool an analyst into seeing deformation of the structure. So each epoch first tests the references against each other, using the measurements between them and the same kind of statistical test. Methods for this, sometimes called congruence testing, look for the largest subset of references that agree with each other between epochs, and treat any that do not as unstable. With three pillars, the test is weak; Ruth's network has a fourth pillar and two distant GNSS-tied monuments for this reason.
Seasonal effects also matter. Concrete pillars can tilt slightly with frost and sun, and heights of benchmarks in clay can rise and fall with moisture. The monitoring record should show these as repeating patterns over a year, which the analysis can then separate from real deformation of the structure. Lesson 10 returns to time series and how to model them.
Other measurements
Geodetic measurements are only part of a monitoring program. Geotechnical instruments measure what the survey cannot: inclinometers in boreholes show sideways movement at depth; piezometers measure water pressure in the dam and its foundation; extensometers measure the opening of joints and cracks; and settlement plates under fills show compression of the ground. The survey ties the tops of these instruments into the same coordinate system, so that all the measurements can be compared. Lesson 10 covers how GNSS and these sensors are combined.
Lidar and photogrammetry (GEOM-350, GEOM-310) add something different: they measure whole surfaces rather than points, which can reveal a bulge on a slope or a crack pattern that point targets would miss. They are less precise per point, but the comparison of two dense surfaces, with methods such as the M3C2 algorithm, can detect changes of a centimeter or so over large areas. For the coulee banks above the canal, the district uses an annual lidar survey for exactly this.
Reporting
A monitoring report gives, for each target, the displacement since the baseline and since the previous epoch, with standard deviations or error ellipses, a statement of which movements are significant, and plots of movement over time. It notes any changes in method, instruments or references, and any observations that were rejected and why. It goes to the engineer of record promptly, within the time the monitoring plan sets, and any alert-level movement is reported immediately by phone as well as in writing.
Settlement around excavations
The second monitoring need, around the pump station's excavation and the launch shaft, is simpler but more urgent. As soil is removed and groundwater is pumped down, the ground nearby settles, and the old gate structure and the canal lining are within a few tens of meters. The crew sets survey nails and small prisms on the gate structure and along the canal lining, plus settlement monuments in the ground at increasing distances from the excavation, and measures them by precise leveling and total station before excavation starts, to get a solid baseline of at least two epochs.
During excavation the readings are frequent, daily or even more often during dewatering, and they are compared with trigger levels the geotechnical engineer has set: a review level, at which the engineer looks at the data, and an action level, at which the contractor must stop and take measures such as adjusting the dewatering or adding support. These levels are often a few millimeters for structures and a few centimeters for open ground. The analysis is the same as for the dam, but the timescale is hours and days instead of months, and the reports go straight to the site meeting.
Simple plots are the most effective tool here. A plot of settlement against time for each point, with the trigger levels drawn as horizontal lines and the construction events marked along the bottom, shows at a glance whether a point is following the expected pattern. The superintendent may not want a chi-square test, but everyone understands a line heading toward a red level.
Common mistakes
MistakeTesting movement against one epoch's standard deviation.
InsteadUse the covariance of the difference, the sum of both epochs' covariances.
MistakeAssuming the reference points are stable.
InsteadTest the references against each other in every epoch.
MistakeChanging instruments or procedures between epochs without noting it.
InsteadKeep methods identical, or document and test the effect of any change.
MistakeReporting a significant movement as dangerous.
InsteadSignificance is statistical; the engineer judges whether it matters.
Summary and key terms
- Deformation monitoring asks whether points have really moved, by amounts close to measurement error.
- Networks use stable reference pillars and well-observed targets, designed by simulation.
- Each epoch is adjusted by least squares; movement is tested against the combined covariance.
- In plan, the test statistic is compared with the chi-square value 5.99 at 95 % for two degrees of freedom.
- Reference stability must be tested, and seasonal patterns separated from real deformation.
- Geodetic, geotechnical and surface measurements together give the full picture.
- Epoch
- One complete set of monitoring measurements.
- Reference point
- A point assumed stable, from which object points are measured.
- Object point
- A point on the structure or ground whose movement is monitored.
- Congruence test
- A test of whether a group of points kept the same relative positions between epochs.
- Alert level
- A movement or rate at which the monitoring plan requires review or action.
- Inclinometer
- A borehole instrument that measures sideways movement at depth.
- Piezometer
- An instrument that measures water pressure in soil or rock.
Practice problems
Work each problem on paper first, then reveal the answer to check.
Each epoch determines a point's height to 1.5 mm. What is the smallest settlement detectable at 95 %?
Show answer
1.96 × √2 × 1.5 ≈ 4.2 mm.
A plan displacement gives T = 3.4. Is it significant at 95 %?
Show answer
No; 3.4 is below 5.99.
Why are monitoring pillars fitted with forced-centering plates?
Show answer
So the instrument returns to exactly the same position each epoch.
All targets appear to move 3 mm west in one epoch. What should be checked first?
Show answer
Whether a reference pillar or the orientation moved.
Why simulate a network before building it?
Show answer
To confirm the planned geometry and observations meet the required precision.
Lesson quiz · 5 questions
Score 60% or more to complete this lesson.
Create a free account to save your progress, take quizzes and earn a certificate.