
GCP-222 · Lesson 5 of 12 · 19 min
Monitoring and troubleshooting pipelines
▶ Video coming soon A video version of this lesson is on the way.
Friday, October 30, starts with a real incident, which Aisha says is the best kind of lesson. At 05:52 the on-call phone received an alert: curated.sales had not been updated for October 29. Mateo watches as Aisha works through it, and then they spend the rest of the session turning what she did by instinct into a checklist he can follow on his own shift next month.
What to watch
A pipeline can fail in more ways than an error message. Aisha groups the signals she watches into four families. Errors are the obvious ones: a job or task that ended in failure. Freshness asks whether the data is as recent as it should be: has today's partition appeared, and when was the table last modified? Volume asks whether the amount of data is plausible: 40 stores normally produce about 30,000 sale lines a night, so 3,000 is a problem even if every job succeeded. Duration asks whether a run is taking much longer than usual, which is often the first sign of a growing table, a bad join or a quota limit, hours before anything fails.
The four families need different tools. Errors appear in logs. Freshness and volume need queries against the data or its metadata. Duration appears in job metrics. A pipeline with only error alerts will miss the most damaging failures, the ones where everything succeeds and the numbers are still wrong.
Cloud Logging and Cloud Monitoring
Almost everything in Google Cloud writes to Cloud Logging: BigQuery jobs, Dataflow workers, Workflows executions, Airflow tasks, Cloud Run requests, Eventarc deliveries. The Logs Explorer lets you filter by resource, severity, time and text, and save queries for reuse. Logs can be routed by sinks to other places: to a BigQuery dataset for analysis over months, to a Cloud Storage bucket for cheap long-term keeping, or to Pub/Sub for other tools. Birchline routes all pipeline-related logs to a BigQuery dataset called ops_logs, which is how Aisha can ask questions such as 'which jobs failed most often last quarter?'
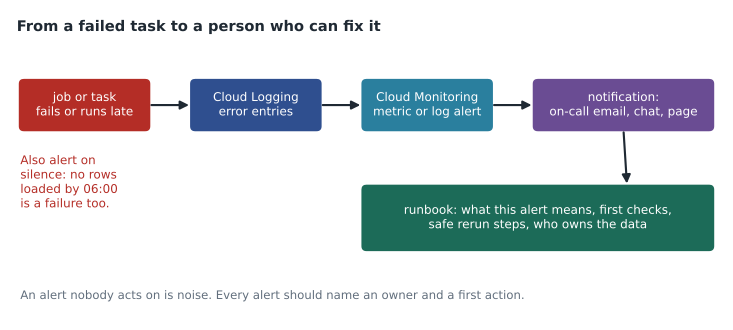
Cloud Monitoring collects metrics: numbers measured over time, such as the number of BigQuery jobs, slots in use, Dataflow system lag, Pub/Sub messages waiting, or Workflows executions that failed. It draws dashboards and evaluates alerting policies, which compare a metric with a condition, such as 'failed executions greater than zero in five minutes', and send a notification through a notification channel: email, a chat app, SMS, a paging service or a Pub/Sub topic. A log-based metric turns matching log entries into a metric, so a specific error message can drive an alert. A log-based alert fires directly on a matching log entry.
-- Logs Explorer query: failed BigQuery jobs in the data project in the last day
resource.type="bigquery_project"
resource.labels.project_id="bl-data-prod"
protoPayload.metadata.jobChange.job.jobStatus.jobState="DONE"
severity>=ERROR
Monitoring BigQuery from the inside
BigQuery describes its own activity in INFORMATION_SCHEMA views. INFORMATION_SCHEMA.JOBS lists every job in a project or region for the last 180 days, with who ran it, when, how long it took, how many bytes it processed, how many slot-milliseconds it used and any error. INFORMATION_SCHEMA.TABLES and the PARTITIONS view show when tables and partitions were last modified and how many rows they hold. These views are ordinary tables to query, so a freshness check is a short SQL statement.
-- Freshness and volume check for yesterday's partition of curated.sales
SELECT
  partition_id,
  total_rows,
  last_modified_time,
  TIMESTAMP_DIFF(CURRENT_TIMESTAMP(), last_modified_time, HOUR) AS hours_since_update
FROM `bl-data-prod.curated.INFORMATION_SCHEMA.PARTITIONS`
WHERE table_name = "sales"
  AND partition_id = REPLACE(CAST(DATE_SUB(CURRENT_DATE("America/New_York"), INTERVAL 1 DAY) AS STRING), "-", "");
Birchline runs a set of these checks as scheduled queries at 06:00. Each one ends with an ERROR() call if the result breaks a rule, which makes the scheduled run fail, which sends the failure notification. Aisha calls this alerting on silence: the absence of data is turned into an error that someone sees.
Monitoring Dataflow, Workflows and Airflow
Each service also has its own view. The Dataflow job UI shows a pipeline as a graph of steps, with the number of elements each step has processed, the throughput, the system lag for streaming jobs (how long the oldest unprocessed element has waited), worker counts and errors. A step whose lag keeps growing is a bottleneck; a step with many errors in its logs is usually a data problem. The Workflows page lists executions with their state, duration, arguments and the step where any failure happened. The Airflow UI shows a grid of DAG runs by date, color-coded by task state, with each task's log one click away.
Mateo notices that the same question, 'which step failed and why?', has a different answer screen in every service. That is why Birchline also writes one summary row per pipeline run into a control table, with the pipeline name, run date, start, end, status and row counts. The 06:00 checks and the morning stand-up both read that one table.
Working through an incident
Aisha's handling of this morning's alert followed the checklist she now writes down for Mateo. First, confirm the symptom: the PARTITIONS view showed no rows for October 29 in curated.sales. Second, find where the chain broke by walking upstream: the Dataform workflow had not started, because the Workflows control step was still waiting for one store. Third, read the error at the point of failure: store 08's file had arrived, but its load had failed with 'too many errors' because the file contained 412 rows with a missing date. Fourth, decide on the fastest safe recovery: quarantine store 08's file, build the curated tables without it, and flag store 08 on the dashboard. Fifth, communicate: a short message to the store operations channel. Sixth, fix the cause during working hours: the store's till had been updated the previous afternoon and wrote dates in a new format.
Mateo models the 06:00 checks to see which rule would have caught which problem, using last week's control-table summaries.
# Evaluate morning checks against one week of pipeline summaries
runs = [  # (date, status, rows loaded, minutes taken, finished at hh:mm)
    ("2026-10-23", "ok", 30410, 74, "03:48"),
    ("2026-10-24", "ok", 31980, 81, "03:55"),
    ("2026-10-25", "ok", 29770, 70, "03:41"),
    ("2026-10-26", "ok", 3050, 22, "03:10"),
    ("2026-10-27", "ok", 30120, 166, "05:16"),
    ("2026-10-28", "ok", 30650, 77, "03:51"),
    ("2026-10-29", "waiting", 0, 0, "--:--"),
]
normal_rows = sorted(r[2] for r in runs if r[1] == "ok")[3]   # median of the 6 ok runs (upper middle)
normal_minutes = sorted(r[3] for r in runs if r[1] == "ok")[3]
for d, status, rows, mins, end in runs:
    problems = []
    if status != "ok": problems.append("not finished (freshness)")
    elif rows < 0.5 * normal_rows: problems.append(f"only {rows} rows (volume)")
    if status == "ok" and mins > 2 * normal_minutes: problems.append(f"{mins} min (duration)")
print(d, "OK" if not problems else "ALERT: " + "; ".join(problems))2026-10-23 OK 2026-10-24 OK 2026-10-25 OK 2026-10-26 ALERT: only 3050 rows (volume) 2026-10-27 ALERT: 166 min (duration) 2026-10-28 OK 2026-10-29 ALERT: not finished (freshness)
What this code does
This takes a week of nightly run summaries and checks each night against three rules: the run must have finished, it must have loaded at least half the usual number of rows, and it must not have taken more than twice the usual time. The usual figures come from the successful runs in the same week. The output flags three nights: one that loaded a tenth of the normal data, one that took more than twice as long as usual, and this morning's run, which has not finished at all.
Three alerts in a week, and only one of them, this morning's, involved a failed or unfinished job. October 26 succeeded while loading about a tenth of the usual rows, the day a storage permission change hid most stores' files; October 27 succeeded but took more than twice the usual time because a join had lost its partition filter. Error alerts alone would have caught neither.
| Symptom | Where to look first | Common causes |
|---|---|---|
| A job failed | The job's error in its own UI or in Cloud Logging | Bad data, schema change, permission removed, quota exceeded |
| Data is stale | Freshness check, then walk upstream through the DAG | An upstream step is waiting, a trigger did not fire, a schedule was paused |
| Too few rows | Control table and source file counts | Missing files, filters, permission changes hiding data |
| A run is much slower | INFORMATION_SCHEMA.JOBS, Dataflow job graph | Lost partition filter, data skew, slot contention |
| Streaming lag grows | Dataflow system lag, Pub/Sub unacknowledged messages | Too few workers, a slow step, a hot key |
On-call, runbooks and service levels
Alerts are only useful if someone is ready to act on them. Birchline's data team runs a weekly on-call rotation: one engineer carries the phone from Monday morning to the following Monday, with a second person as backup. Mateo will join the rotation in December, shadowing Aisha for his first week. The rotation is written down, the alerting policies notify the rotation's channel rather than named people, and the handover each Monday covers anything still open.
Each alert links to a runbook, a short page that answers four questions: what does this alert mean, what should I check first, what is safe to do at 05:45 without asking anyone, and who owns the data if a business decision is needed. The runbook for the curated.sales freshness alert, for example, says that quarantining one store's file and building without it is always allowed, while delaying the dashboard for everyone needs the store operations manager's agreement.
Behind the alerts sit service level objectives, plain statements of what users can expect. Birchline's sales pipeline promises that the curated tables are complete for the previous day by 06:00 on at least 28 of every 30 days, and that any store missing at 06:00 is shown as missing, never as zero. Measuring the pipeline against that promise each month turns arguments about whether things are 'mostly fine' into a number. Over the last 30 days, Aisha counts 29 complete mornings, so the objective was met, though October 26's quiet failure is the reason she added the volume check.
Finally, every incident that wakes someone up ends with a short post-incident review: what happened, how it was found, what fixed it, and what will stop it happening again. The reviews are blameless, focusing on the system rather than the person, and their actions, such as this morning's new rule that till-system updates must be tested with a sample file before they reach stores, go on the team's backlog like any other work.
Worked problem
Setting a duration alert threshold
The nightly build took 74, 81, 70, 77, 79 and 72 minutes on six normal nights. The team wants an alert when a run takes more than one and a half times its median. What is the threshold?
Show solution
- Sort the six times: 70, 72, 74, 77, 79, 81.
- With six values, the median is the average of the middle two: (74 + 77) / 2 = 75.5 minutes.
- One and a half times the median is 1.5 × 75.5 = 113.25 minutes.
- Round to a value people can remember, such as 115 minutes, and review the threshold each quarter as data grows.
Answer: Alert when the build takes more than about 113 minutes; Birchline sets 115.
Common mistakes
MistakeAlerting only on failed jobs.
InsteadAdd freshness, volume and duration checks, because the worst failures often succeed.
MistakeSending alerts to one person's email.
InsteadUse a team notification channel and an on-call rotation.
MistakeWriting alerts with no explanation.
InsteadLink each alert to a runbook that says what it means and what to check first.
MistakeRerunning everything after a failure.
InsteadFind where the chain broke and rerun from that step for the affected date.
MistakeKeeping pipeline logs only for the default retention period.
InsteadRoute the logs you need for trends to BigQuery or Cloud Storage with a sink.
Summary and key terms
- Pipelines fail through errors, stale data, wrong volumes and slow runs, and each needs its own check.
- Cloud Logging collects logs from every service and can route them with sinks to BigQuery, Cloud Storage or Pub/Sub.
- Cloud Monitoring collects metrics, draws dashboards and evaluates alerting policies that notify through channels; log-based metrics and alerts turn log entries into signals.
- BigQuery's INFORMATION_SCHEMA views describe jobs, tables and partitions and make freshness checks simple SQL.
- Dataflow, Workflows and Airflow each have their own run views.
- An incident is worked by confirming the symptom, walking upstream to the break, reading the error, recovering safely, communicating and then fixing the cause.
- Freshness
- How recent the data in a table is compared with what is expected.
- Cloud Logging
- Google Cloud's service for collecting, searching and routing logs.
- Log sink
- A rule that routes matching log entries to BigQuery, Cloud Storage, Pub/Sub or another project.
- Cloud Monitoring
- Google Cloud's service for metrics, dashboards and alerting.
- Alerting policy
- A condition on a metric or log that sends a notification when it is met.
- Log-based metric
- A metric that counts or measures matching log entries.
- INFORMATION_SCHEMA
- BigQuery system views that describe jobs, tables, partitions and more.
- System lag
- In a Dataflow streaming job, how long the oldest unprocessed element has waited.
Practice problems
Work each problem on paper first, then reveal the answer to check.
Why can a successful run still need an alert?
Show answer
It may have loaded far too few rows or taken far too long, which error alerts do not catch.
Where would you look to see how many bytes a scheduled query processed last week?
Show answer
INFORMATION_SCHEMA.JOBS.
What does a growing system lag in a Dataflow streaming job suggest?
Show answer
A bottleneck: the pipeline is not keeping up with incoming data.
List the six steps of Aisha's incident checklist.
Show answer
Confirm the symptom, find where the chain broke, read the error, recover safely, communicate, fix the cause.
Lesson quiz · 5 questions
Score 60% or more to complete this lesson.
Create a free account to save your progress, take quizzes and earn a certificate.