
ELEC-410 · Lesson 1 of 12 · 25 min
Process control systems, P&IDs and loop drawings
Water treatment plants, refineries, food processors, pulp mills, pharmaceutical plants and large building mechanical rooms all depend on continuous processes that must hold pressures, levels, flows and temperatures within tight limits. Instrumentation measures those variables, controllers decide what to do, and final control elements such as valves and variable frequency drives make the change. Electricians install the wiring, raceways, power supplies and grounding for these systems, terminate and test instrument loops, and often work alongside instrumentation technicians during commissioning and troubleshooting. ELEC-330 introduced the 4–20 mA loop and PLC-based PID control. This course goes further into the industrial and building systems an experienced electrician meets: process instrumentation, control valves, hazardous locations, renewable energy and storage, EV charging, fire alarm interfaces and standby power. This first lesson covers how process control systems are organized and how to read the drawings that describe them.
Continuous, batch and discrete processes
Industrial processes fall into three broad types. Continuous processes run around the clock with material flowing steadily, such as a water treatment plant or a paper machine; the control goal is to hold variables at their set points despite disturbances. Batch processes make a fixed quantity of product through a sequence of steps, such as mixing, heating and holding a batch of sauce or a pharmaceutical ingredient; control combines sequencing with regulation during each step. Discrete manufacturing makes individual items, such as cars or packaged goods, and relies mainly on on/off sensing and motion control, the subject of ELEC-330. Many plants combine all three: a brewery brews in batches, filters continuously and packages discretely.
The control loop
Every regulatory control loop has the same parts. A primary element senses the process variable, such as an orifice plate in a pipe or a thermocouple in a vessel. A transmitter converts that measurement into a standard signal, usually 4–20 mA, often with digital HART communication superimposed. A controller, which may be a stand-alone single-loop controller, a PLC or a distributed control system (DCS), compares the process variable (PV) with the set point (SP) and calculates an output (OUT or MV, manipulated variable). A final control element, usually a control valve or a VFD-driven pump or fan, changes the process. The process responds, the transmitter sees the change, and the loop closes.
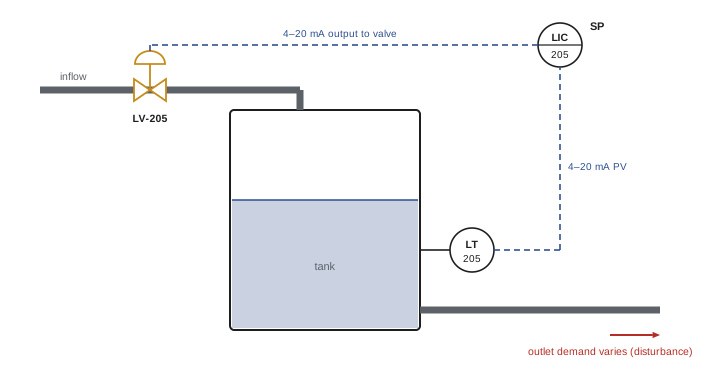
Disturbances, such as changing demand, feed composition or ambient temperature, push the process variable away from the set point, and the controller works continuously to correct them. The quality of control depends on the whole loop: an accurate transmitter is wasted if the valve sticks, and a well-tuned controller cannot overcome a transmitter mounted where it measures the wrong thing.
Control system architecture
Small systems use stand-alone controllers or a single PLC. Large plants use a DCS, in which controllers distributed around the plant handle groups of loops, connected by redundant networks to operator workstations, engineering stations and historians that record data. Safety instrumented systems (SIS), built to standards such as IEC 61511, are kept separate from the basic process control system so that a failure in one cannot disable the other; they shut the process down when a dangerous condition is detected, much as machine safety systems do in ELEC-330. Field signals reach controllers through marshalling cabinets, where field cables are terminated and cross-wired to input/output (I/O) cards, or increasingly through remote I/O and fieldbus networks that reduce home-run wiring.
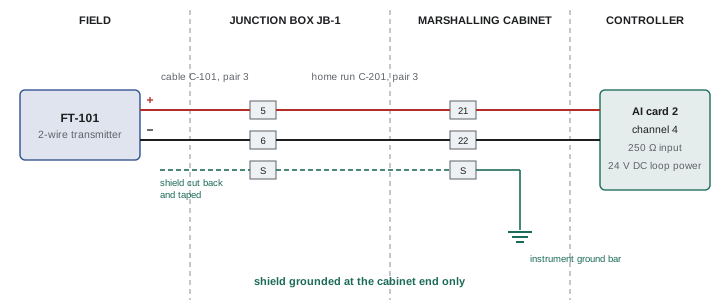
Electricians typically install multi-pair instrument cables from field junction boxes to marshalling cabinets, terminate them on numbered terminal blocks, provide clean instrument power from dedicated, often uninterruptible supplies, and establish the instrument grounding system. Neatness and labeling matter more in instrumentation than almost anywhere else, because a plant may have thousands of nearly identical loops, and every termination must match the drawings exactly.
Piping and instrumentation diagrams
The piping and instrumentation diagram (P&ID) is the master drawing of a process. It shows vessels, pumps, piping, valves and every instrument and control loop, using symbols defined by ANSI/ISA-5.1. Electricians use P&IDs to understand what each instrument does and how loops connect, while the actual wiring is shown on loop diagrams and wiring drawings.
Instruments appear as circles called balloons. A plain circle is a field-mounted instrument; a circle with a horizontal line through it is mounted in a main control room panel and accessible to the operator; a circle with a dashed line is mounted behind the panel or otherwise inaccessible. A circle inside a square represents a function in a shared display or control system, such as a DCS faceplate, and a hexagon represents a computer function. A diamond inside a square represents a PLC function.
Signal lines are drawn with distinct patterns: a solid line for process connections, a line with double cross-hatches for pneumatic signals, a dashed line for electrical signals, a line with small circles for software or data links, and a line with a pattern of small arcs for electromagnetic or sonic signals.
Tag numbers
Every instrument has a tag that identifies its function and loop. The first letter is the measured or initiating variable; succeeding letters describe the function. The loop number follows, often with an area prefix. Common first letters are:
- F flow, L level, P pressure, T temperature, A analysis (such as pH or oxygen), S speed, W weight, Z position, E voltage, I current, J power.
Common succeeding letters are:
- T transmitter, I indicator, C controller, V valve, E primary element, R recorder, S switch, Y relay or compute function (such as an I/P converter), A alarm, with H and L for high and low.
So FT-101 is the flow transmitter in loop 101, FIC-101 the flow indicating controller, FV-101 the flow control valve and FY-101 the current-to-pneumatic converter that drives the valve. LSHH-205 is a high-high level switch, usually part of a shutdown, and TE-310 is a temperature element such as a thermocouple or RTD. A modifier D means difference, so PDT is a differential pressure transmitter, and Q means totalize, so FQI is a flow totalizer.
| Tag | Meaning | Typical device |
|---|---|---|
| PT-110 | Pressure transmitter, loop 110 | Gauge pressure transmitter on a pump discharge |
| PDT-120 | Differential pressure transmitter | DP transmitter across a filter or orifice |
| LIC-205 | Level indicating controller | DCS or PLC level control function |
| FV-101 | Flow control valve | Globe valve with actuator and positioner |
| TE-310 / TT-310 | Temperature element and transmitter | RTD in a thermowell with head-mounted transmitter |
| LSHH-205 | Level switch high-high | Independent switch for overfill shutdown |
| FY-101 | Relay or converter in loop 101 | I/P converter driving a pneumatic valve |
Loop diagrams
A loop diagram, defined by ISA-5.4, shows every wire and connection in one instrument loop from the field device to the controller. It identifies the field instrument and its terminals, the junction box and terminal numbers, the multi-pair cable and pair numbers, the marshalling cabinet terminals, the I/O card and channel, the power supply, shield and ground connections, and often the calibrated range and the action of the valve on air failure. During construction, electricians use loop diagrams to terminate cables; during commissioning, the loop check confirms that every connection matches the diagram and that the signal reaches the correct controller input; and during troubleshooting, the loop diagram tells a technician exactly where to measure. Keeping loop diagrams up to date after changes is essential, because an outdated drawing in an emergency can send a technician to the wrong terminals.
Instrument signals in a modern plant
Although 4–20 mA remains the most common signal, plants use several technologies. HART superimposes a 1,200 Hz frequency-shift-keyed digital signal on the 4–20 mA loop, allowing configuration, diagnostics and secondary variables without extra wiring; a handheld communicator or asset management software connects across a 250 Ω resistance in the loop. Fully digital fieldbuses, such as FOUNDATION Fieldbus H1 and PROFIBUS PA, carry several devices on one pair with power, and Ethernet-APL now brings Ethernet to two-wire field devices, including in hazardous areas. WirelessHART and ISA100 wireless transmitters avoid cabling entirely for monitoring points. Electricians need to know which technology each loop uses, because the wiring rules for termination, polarity, terminators and grounding differ.
Worked problem
Reading a tag and finding the wiring
A P&ID shows a balloon labeled LIC-205 with a horizontal line, connected by a dashed line to LT-205 in the field and to LV-205 on the tank inlet. Describe each device and where you would find its wiring details.
Show solution
- LT-205 is a field-mounted level transmitter in loop 205.
- LIC-205, in a circle with a horizontal line, is a level indicating controller accessible to the operator in the control room (in a square, it would be a DCS function).
- LV-205 is the level control valve that changes inflow.
- The dashed lines show electrical signals, normally 4–20 mA.
- The terminal-by-terminal wiring is on the loop diagram for loop 205, which lists cables, pairs, junction boxes, I/O channel and power supply.
Answer: Transmitter, controller and valve of level loop 205; the loop diagram gives the actual connections.
The electrician's role on an instrumentation project
On a typical industrial project, responsibilities are divided among trades. Pipefitters install process piping and in-line instruments such as flowmeters and control valves; instrument fitters or technicians install impulse tubing, mount transmitters and calibrate devices; and electricians install cable tray, conduit, instrument cables, power to instruments and control panels, grounding, and terminations. The boundaries vary by region and contract, and in many smaller facilities a single industrial electrician with instrumentation training does it all. In Canada, the Instrumentation and Control Technician trade has its own Red Seal designation, while in the United States, instrumentation work is often performed by industrial electricians or instrument technicians certified through employer and union programs. Whatever the division, the electrician who understands what each instrument does will install it better and find faults faster.
A disciplined workflow keeps large projects under control. Cables are pulled according to a cable schedule that lists each cable's tag, type, size, route and both end points. Each cable is labeled at both ends before termination. Terminations follow the loop and wiring diagrams, and a second person checks them before loop checking. Every deviation from the drawings, such as a spare pair used because a pair was damaged, is marked in red on a working copy and later transferred to the record drawings. These habits seem slow at first but prevent days of troubleshooting during start-up, when the whole project team is waiting.
Documents beyond the P&ID
Several other documents support instrumentation work. The instrument index lists every tag with its service, type, range, manufacturer, location and the drawings on which it appears. Instrument data sheets specify each device in detail: process conditions, materials, range, output, power supply and hazardous area certification. Hook-up drawings show how a transmitter connects to the process, including taps, valves, tubing and supports, often as standard details reused for many similar instruments. Cause and effect charts, used for safety systems and interlocks, list initiating events in rows and resulting actions in columns, much like the fire alarm matrices in Lesson 11. Control narratives describe in words how each part of the process is controlled. Reading these together with the P&ID and loop diagrams gives the complete picture of a loop: what it measures, how it is built, how it is wired and what it is supposed to do.
Common mistakes
MistakeWiring from the P&ID alone.
InsteadUse the loop diagram for terminals, pairs and channels.
MistakeReading the first tag letter as the device type.
InsteadThe first letter is the measured variable; later letters are functions.
MistakeLeaving marked-up changes off the drawings.
InsteadReturn red-lined loop diagrams so records stay accurate.
MistakeMixing safety system wiring with control wiring.
InsteadKeep SIS circuits separate and clearly identified.
MistakeAssuming every loop is plain 4–20 mA.
InsteadCheck for HART, fieldbus or Ethernet-APL wiring rules.
Summary and key terms
- Processes are continuous, batch or discrete, and plants often combine them.
- A loop has a primary element, transmitter, controller and final control element.
- Large plants use a DCS with separate safety instrumented systems.
- P&IDs show instruments and loops with ISA-5.1 symbols.
- Tags give the measured variable first, then functions, then the loop number.
- Loop diagrams show every conductor, terminal, shield and channel.
- HART, fieldbus, Ethernet-APL and wireless supplement 4–20 mA.
- Process variable
- The measured quantity being controlled.
- Set point
- The desired value of the process variable.
- Final control element
- The device that changes the process, such as a valve.
- DCS
- Distributed control system for large plants.
- SIS
- Safety instrumented system that shuts down a process.
- P&ID
- Piping and instrumentation diagram.
- Balloon
- The circle symbol for an instrument on a P&ID.
- Loop diagram
- Drawing of every connection in one instrument loop.
- Marshalling cabinet
- Enclosure where field cables are cross-wired to I/O.
- HART
- Digital signal superimposed on a 4–20 mA loop.
Practice problems
Work each problem on paper first, then reveal the answer to check.
Name the four main parts of a control loop.
Show answer
Primary element, transmitter, controller, final control element.
What does a horizontal line through a balloon mean?
Show answer
Mounted in the main control room, accessible to the operator.
Decode PDT-120.
Show answer
Differential pressure transmitter, loop 120.
Decode LSHH-205.
Show answer
Level switch high-high, loop 205.
What is FY-101 typically?
Show answer
An I/P converter or relay in loop 101.
What line pattern represents an electrical signal on a P&ID?
Show answer
A dashed line.
What does a loop diagram show that a P&ID does not?
Show answer
Terminals, cables, pairs, channels, power and shields.
Why is the SIS separate from the control system?
Show answer
So a failure in one cannot disable the other.
How does a HART communicator connect?
Show answer
Across a loop with at least 250 Ω resistance.
Give an example of a batch process.
Show answer
Brewing, mixing a food batch, pharmaceuticals.
Lesson quiz · 5 questions
Score 60% or more to complete this lesson.
Create a free account to save your progress, take quizzes and earn a certificate.