
ECON-102 · Lesson 5 of 12 · 27 min
Long-run economic growth and productivity
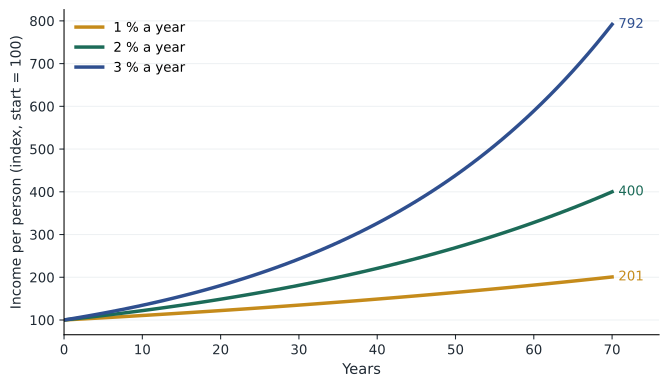
In the long run, nothing matters more for living standards than economic growth. Small differences in growth rates, compounded over decades, produce enormous differences in income. A country whose real income per person grows 2 % a year doubles its living standards in about 35 years; one that grows 1 % a year takes about 70 years. The difference between rich and poor countries today is largely the result of differences in growth over the past two centuries. This lesson explains how growth is measured, what drives it, why productivity is the key, and why Canada's productivity performance has become a pressing policy concern.
The power of compounding
Growth compounds, like interest in a savings account. If real GDP per capita is \( Y_0 \) today and grows at rate \( g \) per year, after \( t \) years it will be \( Y_t = Y_0 (1 + g)^t \). A handy approximation is the rule of 70: a quantity growing at \( g \) % per year doubles in about \( 70 \div g \) years. At 1 % it doubles in about 70 years, at 2 % in 35 years, at 3.5 % in 20 years, and at 7 %, the pace achieved by China for several decades, in just 10 years.
Worked problem
Compounding and the rule of 70
Country A has real GDP per capita of 50,000 dollars growing at 1 % a year. Country B has 25,000 dollars growing at 3 % a year. How long until B catches up, and what are both incomes then?
Show solution
- B catches up when 25,000 × 1.03^t = 50,000 × 1.01^t.
- Divide: (1.03 ÷ 1.01)^t = 2, so t = ln 2 ÷ ln(1.03 ÷ 1.01) ≈ 0.693 ÷ 0.0196 ≈ 35.3 years.
- A's income then: 50,000 × 1.01^35.3 ≈ 71,000 dollars.
- B's income is the same, about 71,000 dollars.
Answer: B catches up in about 35 years. A two-point growth advantage closes a twofold income gap in a working lifetime.
import math
# Doubling times: rule of 70 versus exact, and catch-up between two countries
for g in (1, 2, 3, 3.5, 7):
    exact = math.log(2) / math.log(1 + g / 100)
    print(f"growth {g:>3} %: rule of 70 {70 / g:5.1f} years, exact {exact:5.1f} years")
a, b, ga, gb = 50_000, 25_000, 0.01, 0.03
years = 0
while b < a:
    a *= 1 + ga; b *= 1 + gb; years += 1
print(f"Country B overtakes A after {years} years, at about {b:,.0f} dollars per person")growth 1 %: rule of 70 70.0 years, exact 69.7 years growth 2 %: rule of 70 35.0 years, exact 35.0 years growth 3 %: rule of 70 23.3 years, exact 23.4 years growth 3.5 %: rule of 70 20.0 years, exact 20.1 years growth 7 %: rule of 70 10.0 years, exact 10.2 years Country B overtakes A after 36 years, at about 72,457 dollars per person
Productivity: the key to growth
Output per person can be broken into two parts: output per hour worked (labor productivity) and hours worked per person. Hours per person cannot rise much over the long run; indeed, as countries get richer, people tend to choose more leisure, so average hours have fallen over the past century. Sustained increases in living standards therefore depend almost entirely on rising labor productivity, producing more output with each hour of work. As the economist Paul Krugman put it, productivity is not everything, but in the long run it is almost everything.
What determines labor productivity? Economists point to four main factors. Physical capital per worker: workers with more and better machines, tools, buildings and software produce more. Human capital: workers with more education, training and experience are more productive. Natural resources: land, minerals and energy contribute, though resource wealth is neither necessary nor sufficient for prosperity, as resource-poor Japan and Switzerland and resource-rich but poorer countries show. And technology and knowledge: better ways of combining inputs, from the assembly line to the internet. The aggregate production function summarizes these relationships.
Here \( Y \) is output, \( K \) physical capital, \( L \) labor, \( H \) human capital, \( N \) natural resources, and \( A \) total factor productivity (TFP), which captures technology and the efficiency with which inputs are combined. A frequently used specific form is the Cobb-Douglas production function, \( Y = A K^{\alpha} L^{1-\alpha} \), where \( \alpha \), capital's share of income, is about one third in most advanced economies.
Diminishing returns and the Solow model
A key insight, developed by Robert Solow in the 1950s, is that capital is subject to diminishing returns. Adding machines to a workforce raises output, but each additional machine adds less than the one before. If an economy simply saves and invests more, it accumulates capital and grows faster for a while, but as capital per worker rises, the extra output from each new unit of capital falls, and depreciation, the wearing out of existing capital, absorbs more investment. Eventually the economy reaches a steady state in which investment just replaces depreciated capital and capital per worker stops growing. A higher saving rate raises the level of output per worker in the steady state but not its long-run growth rate.
The Solow model's conclusion is striking: sustained growth in output per worker requires sustained growth in technology, \( A \). Capital accumulation alone cannot do it. The model also predicts conditional convergence: poorer countries with less capital per worker should grow faster than richer ones, other things equal, because their returns to capital are higher. Convergence has happened among countries with similar institutions, such as the advanced economies after the Second World War and many East Asian economies, but not among the world's countries generally, which tells us that institutions, education and policies differ in important ways.
Growth accounting
Growth accounting splits growth in output into contributions from growth in capital, labor and TFP. Using the Cobb-Douglas form, output growth equals TFP growth plus capital's share times capital growth plus labor's share times labor growth. TFP growth cannot be measured directly; it is calculated as the residual, the part of output growth not explained by input growth, which is why it is sometimes called a measure of our ignorance.
Worked problem
Growth accounting
Real output grows 2.4 % a year, the capital stock grows 3.0 % and hours worked grow 1.2 %. Capital's share is 0.35. Find the contributions and TFP growth.
Show solution
- Capital contribution = 0.35 × 3.0 = 1.05 points.
- Labor contribution = 0.65 × 1.2 = 0.78 points.
- TFP growth = 2.4 − 1.05 − 0.78 = 0.57 %.
- Labor productivity growth = 2.4 − 1.2 = 1.2 % a year.
Answer: About 0.6 points of growth come from TFP, the rest from more capital and more hours. Labor productivity grows 1.2 % a year, of which roughly half is capital deepening and half TFP.
# Simple Solow simulation: higher saving raises the level of output, not its long-run growth
def simulate(s, years=200, alpha=1/3, delta=0.05, n=0.01, g=0.015):
    k, A = 1.0, 1.0              # capital per worker, technology
    path = []
    for t in range(years):
        y = A * k ** alpha
        path.append(y)
        k = (s * y + (1 - delta) * k) / ((1 + n))
        A *= 1 + g
    return path

low, high = simulate(0.20), simulate(0.30)
for t in (0, 25, 50, 100, 199):
    print(f"year {t:3d}: output per worker  s=20 % {low[t]:6.2f}   s=30 % {high[t]:6.2f}   ratio {high[t] / low[t]:.2f}")
gl = (low[199] / low[189]) ** (1 / 10) - 1
gh = (high[199] / high[189]) ** (1 / 10) - 1
print(f"long-run growth: s=20 % {gl * 100:.2f} %/yr, s=30 % {gh * 100:.2f} %/yr")year 0: output per worker s=20 % 1.00 s=30 % 1.00 ratio 1.00 year 25: output per worker s=20 % 2.50 s=30 % 3.00 ratio 1.20 year 50: output per worker s=20 % 4.66 s=30 % 5.67 ratio 1.22 year 100: output per worker s=20 % 14.48 s=30 % 17.73 ratio 1.22 year 199: output per worker s=20 % 132.31 s=30 % 162.04 ratio 1.22 long-run growth: s=20 % 2.26 %/yr, s=30 % 2.26 %/yr
In the simulation, the economy with the higher saving rate ends up with output per worker about 22 % higher, but in the long run both grow at the same rate, set by technology (here 1.5 % a year for TFP, which raises output per worker by about 2.25 % a year once capital adjusts). This is the Solow model's central lesson in numbers.
Where technology comes from
If technology drives long-run growth, what drives technology? Endogenous growth theory, developed by Paul Romer and others from the 1980s, treats ideas as the product of deliberate investment in research and development. Ideas are unusual goods: once discovered, they can be used by many people at once without being used up. This non-rivalry means that a larger population and a larger market can support more innovation, and that the returns to ideas spill over to others, so private firms may underinvest in research without public support or protection. Patents, copyrights, public funding of basic research, universities, R&D tax credits and immigration of skilled workers all affect the pace of innovation.
Institutions matter as well. Daron Acemoglu, Simon Johnson and James Robinson, who shared the 2024 Nobel prize in economics, argue that inclusive institutions, which secure property rights, enforce contracts, constrain the power of elites and allow broad participation in economic life, explain much of the long-run difference between rich and poor countries. Openness to trade and ideas, macroeconomic stability, competition, the rule of law and good infrastructure all support growth. Joel Mokyr, Philippe Aghion and Peter Howitt, who shared the 2025 prize, studied how innovation-driven growth depends on a culture that values useful knowledge and on creative destruction, the process by which new firms and technologies replace old ones.
Canada's productivity challenge
US labor productivity growth has outpaced that of most other advanced economies since the mid-1990s. The information technology boom raised productivity growth to about 3 % a year from 1995 to 2004, before it slowed to around 1.5 % in the decade after the 2008 financial crisis. Productivity growth picked up again after 2020, averaging about 2 % a year, as firms adopted digital tools, new businesses formed at a high rate and workers moved to more productive jobs. Output per hour in the United States is now among the highest in the world, well above the levels in Canada (roughly a third or more higher) and most of Europe. BUS-230 lesson 1 looks at productivity from a manager's perspective.
| Factor | How it raises productivity | Policy levers |
|---|---|---|
| Physical capital | More and better equipment per worker | Investment tax incentives, stable interest rates |
| Human capital | Skills and knowledge of workers | Education, training, credential recognition |
| Technology (TFP) | Better ways of combining inputs | R&D support, competition, openness to ideas |
| Institutions | Secure property rights, contracts, low corruption | Rule of law, effective regulation |
| Market integration | Scale, specialization and competition | Trade agreements, removing internal trade barriers |
Artificial intelligence and future growth
Will artificial intelligence raise productivity growth? Optimists point out that generative AI can assist with writing, coding, customer service, research and analysis, tasks performed by a large share of workers, and early studies of specific tasks find sizable time savings. Some forecasters expect AI to add a percentage point or more to annual productivity growth over the next decade. Skeptics note that general-purpose technologies such as electricity and computers took decades to transform productivity, because firms had to reorganize their processes and workers had to learn new skills, and that many task-level gains may be modest once quality checks are included. There is also debate about distribution: AI may raise the productivity of less experienced workers most, or it may displace some occupations. The honest answer is that the effect on aggregate productivity is still uncertain, and the official statistics in 2026 do not yet show a clear economy-wide boost.
Common mistakes
MistakeSaving more permanently raises the growth rate.
InsteadIn the Solow model, higher saving raises the level of output per worker; long-run growth depends on technology.
MistakeGrowth of total GDP shows living standards are rising.
InsteadPopulation growth can raise GDP while output per person stagnates; look at per capita and per hour figures.
MistakeNatural resources guarantee prosperity.
InsteadInstitutions, human capital and technology matter more; many resource-rich countries are poor.
MistakeTFP is measured directly.
InsteadTFP is calculated as a residual after subtracting the contributions of capital and labor.
MistakeA 1 % difference in growth hardly matters.
InsteadOver 35 years it changes income by about 40 %.
Summary and key terms
- Compounding makes small differences in growth rates produce large differences in income; the rule of 70 approximates doubling times.
- Sustained increases in living standards depend on rising labor productivity.
- Productivity depends on physical capital, human capital, natural resources and technology.
- In the Solow model, diminishing returns mean capital accumulation alone cannot sustain growth; technology is the engine.
- Growth accounting splits output growth into capital, labor and TFP contributions.
- Ideas, research, competition and inclusive institutions drive technological progress.
- Canada's productivity lags the United States, and the effect of AI on future growth remains uncertain.
- Economic growth
- A sustained increase in real output, usually measured per person.
- Rule of 70
- An approximation: doubling time equals 70 divided by the percentage growth rate.
- Labor productivity
- Output per hour worked.
- Human capital
- The knowledge and skills of workers.
- Total factor productivity (TFP)
- Output growth not explained by growth in measured inputs.
- Diminishing returns
- Each extra unit of an input adds less output when other inputs are fixed.
- Steady state
- In the Solow model, the point where capital per effective worker stops changing.
- Conditional convergence
- The tendency for poorer economies to grow faster than richer ones with similar fundamentals.
- Endogenous growth
- Theories that explain technological progress as the result of economic decisions.
- Creative destruction
- The replacement of old firms and technologies by new ones.
Practice problems
Work each problem on paper first, then reveal the answer to check.
At 2.5 % growth, how long to double?
Show answer
About 28 years.
Real income of 40,000 dollars grows 2 % a year for 30 years. What is it then?
Show answer
40,000 × 1.02^30 ≈ 72,450 dollars.
Why can't hours per person drive long-run growth?
Show answer
Hours cannot rise without limit and tend to fall as people choose more leisure.
Output grows 3 %, capital 4 %, labor 1 %, capital share 0.3. Find TFP growth.
Show answer
3 − 1.2 − 0.7 = 1.1 %.
What happens in the Solow model if the saving rate rises?
Show answer
Output per worker rises to a higher steady-state level; long-run growth is unchanged.
Why are ideas non-rival?
Show answer
Many people can use an idea at once without using it up.
Give two explanations for Canada's productivity gap.
Show answer
Low business investment, weak competition, small firms, internal trade barriers, slow technology adoption.
What is conditional convergence?
Show answer
Poorer economies grow faster than richer ones with similar institutions and policies.
Why might AI's productivity effects take time?
Show answer
Firms must reorganize and workers must learn new skills, as with past general-purpose technologies.
Portfolio task: find your country's labor productivity growth over the last four quarters and compare it with the average since 2000.
Show answer
Answers vary; should cite official productivity data.
Lesson quiz · 5 questions
Score 60% or more to complete this lesson.
Create a free account to save your progress, take quizzes and earn a certificate.