
ECON-102 · Lesson 11 of 12 · 31 min
Open-economy macroeconomics: trade, exchange rates and the balance of payments
No economy is an island, and some are much less of an island than others. Canada sells about a third of what it produces to foreign buyers, roughly three quarters of its goods exports go to the United States, and the value of the Canadian dollar is front-page news. The United States trades a smaller share of its output but issues the world's main reserve currency, so its interest rates and exchange rate affect economies everywhere. This lesson extends the macroeconomic tools of earlier lessons to the open economy: the balance of payments, the link between saving, investment and the trade balance, exchange rates and what moves them, purchasing power parity, and the macroeconomic effects of trade policy. The microeconomics of trade and the effects of specific tariffs on supply chains are covered in ECON-101 lesson 2 and BUS-230 lesson 12.
The balance of payments
The balance of payments records all transactions between a country's residents and the rest of the world. It has two main parts. The current account records trade in goods and services, investment income (interest, dividends and profits paid to and received from foreigners) and transfers such as remittances and foreign aid. The financial account (with the small capital account) records cross-border purchases of assets: foreign direct investment such as building a factory or buying a company, portfolio investment in stocks and bonds, and bank lending. Because every purchase from abroad must be paid for somehow, the current account balance and the financial account balance are mirror images, apart from statistical discrepancy. A country with a current account deficit must be selling assets to foreigners or borrowing from them, a net financial inflow; a country with a current account surplus is acquiring foreign assets.
The United States has run current account deficits almost every year since the early 1980s, often around 3 to 4 % of GDP in recent years. As a result, foreigners have accumulated large holdings of US assets, and the US net international investment position, foreign-owned US assets minus US-owned foreign assets, is negative by more than 20 trillion dollars. The BEA publishes the balance of payments quarterly. Because the dollar is the world's main reserve currency and US Treasury securities are viewed as the safest liquid asset, foreign demand for US assets has made financing these deficits relatively easy.
Worked problem
Balance of payments accounting
A country exports 600 and imports 650 of goods and services, receives 40 of investment income and pays 70, and sends 10 of net transfers abroad (billions). What is the current account balance and what must the financial account show?
Show solution
- Trade balance = 600 − 650 = −50.
- Net investment income = 40 − 70 = −30.
- Current account = −50 − 30 − 10 = −90.
- Financial account = +90: net sales of assets to foreigners or borrowing from abroad of 90.
Answer: A current account deficit of 90 billion is financed by a net financial inflow of 90 billion.
Saving, investment and the current account
Lesson 6 showed that in a closed economy saving equals investment. In an open economy, the expenditure identity \( Y = C + I + G + NX \) rearranges to \( S - I = NX \): national saving minus domestic investment equals net exports, which (ignoring income flows) equals the current account. A country that invests more than it saves must borrow the difference from abroad and run a current account deficit; a country that saves more than it invests lends abroad and runs a surplus.
This identity changes how we should think about trade deficits. A trade deficit is not necessarily a sign of weakness or unfair trade; it reflects a country's saving and investment decisions. A fast-growing country with attractive investment opportunities may sensibly borrow abroad to invest more than it saves. A country with a large government deficit and low household saving will tend to run a current account deficit, because national saving is low. Policies aimed at reducing a trade deficit, such as tariffs, will not succeed in the long run unless they change national saving or investment; if they merely reduce imports, the exchange rate tends to adjust and exports fall too. Economists widely agree on this point, even though trade deficits remain politically contentious.
Worked problem
Twin deficits
An economy has private saving of 18 % of GDP, a government deficit of 6 % of GDP and investment of 20 % of GDP. What is its current account balance? What happens if the government deficit falls to 2 % and investment is unchanged?
Show solution
- National saving = 18 − 6 = 12 % of GDP.
- S − I = 12 − 20 = −8 % of GDP: a current account deficit of 8 %.
- With a deficit of 2 %: national saving = 16 %, S − I = −4 %.
Answer: Reducing the government deficit by 4 points cuts the current account deficit by 4 points, if private saving and investment do not change. In practice they adjust partly, so the link between budget and trade deficits is real but less than one for one.
Exchange rates
The nominal exchange rate is the price of one currency in terms of another. It can be quoted either way: in October 2026 one US dollar cost about 1.41 Canadian dollars, which is the same as saying one Canadian dollar cost about 0.71 US dollars. When a currency buys more foreign currency, it has appreciated; when it buys less, it has depreciated. A depreciation makes a country's exports cheaper for foreigners and its imports more expensive at home, which tends to raise net exports.
Canada and the United States both have floating exchange rates, determined in foreign exchange markets by supply and demand. The Canadian dollar has floated since 1970 (and also from 1950 to 1962). Many other countries peg their currencies to the US dollar or the euro, or manage them closely. Fixed and floating regimes each have advantages. A floating rate lets a country run its own monetary policy and acts as a shock absorber: when commodity prices fall, the Canadian dollar tends to depreciate, cushioning the blow to exporters. A fixed rate provides certainty for trade but means giving up independent monetary policy, a constraint known as the impossible trinity or trilemma: a country cannot simultaneously have a fixed exchange rate, free capital movement and independent monetary policy.
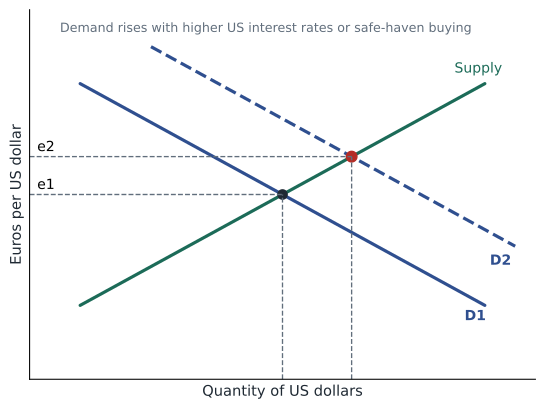
What moves exchange rates? Demand for a currency comes from foreigners buying the country's exports and assets; supply comes from residents buying foreign goods and assets. Factors that raise demand for a currency include higher domestic interest rates relative to foreign rates, which attract financial inflows; higher prices for the country's exports, such as oil for Canada; stronger expected growth; and safe-haven demand in times of global stress, which tends to benefit the US dollar. Exchange rates are notoriously hard to forecast in the short run, because they respond quickly to news about interest rates, commodities and risk.
The US dollar's role as the dominant reserve currency means that it often strengthens during global crises, as investors seek safety, even when the crisis starts in the United States, as in 2008. A strong dollar makes US exports less competitive and lowers import prices, helping to restrain inflation, and it raises the burden of dollar-denominated debts in other countries. Movements in US interest rates therefore ripple through exchange rates worldwide.
Real exchange rates and purchasing power parity
The real exchange rate adjusts the nominal exchange rate for price levels. It measures how many units of foreign goods one unit of domestic goods can buy, and it is what matters for competitiveness. If Canadian prices rise 5 % while US prices rise 2 % and the nominal exchange rate is unchanged, Canadian goods have become relatively more expensive: the real exchange rate has appreciated by about 3 %.
Here \( e \) is the nominal rate (foreign currency per domestic unit), \( P \) the domestic price level and \( P^{*} \) the foreign price level. The theory of purchasing power parity (PPP) says that, in the long run, exchange rates should adjust so that a basket of goods costs the same in different countries, leaving the real exchange rate stable. PPP rests on the idea of arbitrage: if goods were much cheaper in one country, traders would buy there and sell elsewhere. In practice PPP holds only loosely and over long periods, because many goods and services are not traded, transport costs and trade barriers exist, and products differ. The Economist magazine's Big Mac index is a light-hearted illustration that compares burger prices around the world.
Worked problem
Purchasing power parity with burgers (illustrative)
A burger costs 7.60 Canadian dollars in Toronto and 5.80 US dollars in Chicago. The market exchange rate is 1.41 Canadian dollars per US dollar. What exchange rate would equalize burger prices, and is the Canadian dollar over- or undervalued by this measure?
Show solution
- PPP rate = 7.60 ÷ 5.80 = 1.31 Canadian dollars per US dollar.
- At the market rate, the Toronto burger costs 7.60 ÷ 1.41 = 5.39 US dollars.
- Canadian price relative to US = 5.39 ÷ 5.80 = 0.93.
Answer: By this measure the Canadian dollar is about 7 % undervalued: at market exchange rates, the burger is cheaper in Toronto. The prices are illustrative, and one product is a weak test of PPP.
# Purchasing power parity and the real exchange rate (illustrative prices)
cad_per_usd = 1.41
prices = {  # item: (price in CAD in Canada, price in USD in the US)
    'Burger': (7.60, 5.80),
    'Movie ticket': (15.00, 13.50),
    'Haircut': (32.00, 30.00),
    'Smartphone': (1350.00, 999.00),
}
for item, (cad, usd) in prices.items():
    ppp = cad / usd
    gap = (ppp / cad_per_usd - 1) * 100
    status = 'undervalued' if gap < 0 else 'overvalued'
    print(f"{item:13s} PPP rate {ppp:5.2f} CAD/USD  -> CAD {status} by {abs(gap):4.1f} %")
# real exchange rate change: Canadian inflation 3.1 %, US 3.7 %, nominal CAD falls 2 %
real_change = (1 - 0.02) * 1.031 / 1.037 - 1
print(f"Real CAD exchange rate change: {real_change * 100:.2f} %")Burger PPP rate 1.31 CAD/USD -> CAD undervalued by 7.1 % Movie ticket PPP rate 1.11 CAD/USD -> CAD undervalued by 21.2 % Haircut PPP rate 1.07 CAD/USD -> CAD undervalued by 24.3 % Smartphone PPP rate 1.35 CAD/USD -> CAD undervalued by 4.2 % Real CAD exchange rate change: -2.57 %
The results differ across goods, which illustrates why PPP is only a long-run tendency. Traded goods such as smartphones tend to have prices closer to parity once taxes and distribution costs are considered, while non-traded services such as haircuts reflect local wages and rents.
Interest rates, capital flows and monetary policy in an open economy
With free capital movement, investors compare returns across countries. If Canadian interest rates are lower than US rates, investors will hold Canadian assets only if they expect the Canadian dollar to appreciate enough to make up the difference, a relationship called uncovered interest parity. In practice, when a central bank cuts its policy rate relative to other countries, its currency tends to depreciate. This exchange rate channel strengthens monetary policy: a rate cut stimulates the economy both through lower borrowing costs and through a cheaper currency that boosts net exports. It also means that a small open economy cannot set its interest rates entirely independently of the large economies around it without consequences for its exchange rate, which in turn affects inflation through import prices.
Fiscal policy works differently in an open economy with a floating exchange rate. Government borrowing tends to push up domestic interest rates, attracting capital inflows and appreciating the currency, which reduces net exports and offsets part of the fiscal stimulus. This insight, from the Mundell-Fleming model developed by the Canadian-born economist Robert Mundell and the British economist Marcus Fleming in the 1960s, suggests that monetary policy is relatively more powerful, and fiscal policy relatively weaker, in small open economies with floating exchange rates. Mundell received the Nobel prize in economics in 1999.
Trade policy and the macroeconomy
Tariffs are taxes on imports. Their microeconomic effects, deadweight losses, higher prices for consumers and gains for protected producers, were covered in ECON-101. At the macroeconomic level, tariffs act like a negative supply shock for the importing country, raising prices and costs for businesses that use imported inputs, and like a negative demand shock for the exporting country, reducing its exports. Retaliation spreads the damage. Uncertainty about future trade rules also discourages business investment, which can be as important as the tariffs themselves.
The tariffs the United States imposed on many trading partners in 2025 raised the average effective US tariff rate to its highest level in decades. Supporters argued that tariffs would protect strategic industries, encourage domestic manufacturing and raise revenue; critics, including most economists, argued that they would raise prices, invite retaliation and reduce growth without closing the trade deficit, which reflects saving and investment. In February 2026 the Supreme Court ruled that tariffs imposed under emergency powers were unlawful, and refunds followed; tariffs under other laws, such as Section 232 national security tariffs on steel, aluminum, copper, autos and lumber, remained. The macroeconomic effects are still being studied. BUS-230 lesson 12 covers the tariff details for supply chains.
Common mistakes
MistakeA trade deficit means a country is losing.
InsteadIt reflects saving and investment choices; it is financed by financial inflows and can accompany strong growth.
MistakeTariffs reliably eliminate trade deficits.
InsteadUnless national saving or investment change, the exchange rate and exports adjust and the deficit persists.
MistakeA weaker currency is always bad.
InsteadIt helps exporters and import-competing firms, though it raises import prices and can add to inflation.
MistakePPP holds at every moment.
InsteadPPP is a loose long-run tendency; non-traded goods, transport costs and barriers keep prices apart.
MistakeA small open economy can set interest rates without any constraint.
InsteadWith floating rates it can, but rate differences move the exchange rate, which affects inflation and output.
Summary and key terms
- The balance of payments records the current account and the financial account, which mirror each other.
- National saving minus investment equals net exports, so trade balances reflect saving and investment decisions.
- Exchange rates are set by supply and demand in floating regimes; interest rates, commodity prices, growth and risk move them.
- The trilemma: a country cannot have a fixed exchange rate, free capital flows and independent monetary policy at once.
- The real exchange rate adjusts for price levels; PPP holds loosely in the long run.
- In small open economies with floating rates, monetary policy works partly through the exchange rate, and fiscal policy is partly offset by currency appreciation.
- Tariffs act as supply shocks for importers and demand shocks for exporters, and trade uncertainty depresses investment.
- Balance of payments
- A record of all transactions between residents and the rest of the world.
- Current account
- Trade in goods and services, investment income and transfers.
- Financial account
- Cross-border purchases and sales of assets.
- Net international investment position
- A country's foreign assets minus its foreign liabilities.
- Nominal exchange rate
- The price of one currency in terms of another.
- Appreciation
- An increase in the value of a currency relative to others.
- Real exchange rate
- The nominal exchange rate adjusted for relative price levels.
- Purchasing power parity (PPP)
- The theory that exchange rates adjust to equalize the prices of goods across countries.
- Trilemma
- The impossibility of combining a fixed exchange rate, free capital flows and independent monetary policy.
- Uncovered interest parity
- The condition that interest rate differences are offset by expected exchange rate changes.
Practice problems
Work each problem on paper first, then reveal the answer to check.
Exports 400, imports 450, net income −20, transfers −5. Current account?
Show answer
−75.
What must the financial account show in the previous question?
Show answer
A net inflow of 75.
S = 22 % of GDP, I = 25 %. What is net exports as a share of GDP?
Show answer
−3 %.
One USD costs 1.40 CAD. How many USD does one CAD buy?
Show answer
About 0.714.
Name three factors that make a currency appreciate.
Show answer
Higher relative interest rates, higher export prices, stronger growth, safe-haven demand.
What is the trilemma?
Show answer
A country cannot have a fixed exchange rate, free capital movement and independent monetary policy at once.
A coffee costs 5 CAD in Canada and 4 USD in the US. What is the PPP exchange rate?
Show answer
1.25 CAD per USD.
Domestic inflation 4 %, foreign 2 %, nominal rate unchanged. What happens to the real exchange rate?
Show answer
It appreciates by about 2 %.
Why is fiscal policy weaker in a small open economy with a floating rate?
Show answer
Higher interest rates appreciate the currency, reducing net exports.
Portfolio task: find your country's latest current account balance and the exchange rate trend over the past year, and explain one factor behind each.
Show answer
Answers vary; should cite official data.
Lesson quiz · 5 questions
Score 60% or more to complete this lesson.
Create a free account to save your progress, take quizzes and earn a certificate.