
ECON-102 · Lesson 3 of 12 · 28 min
Measuring prices and inflation
Inflation is a sustained rise in the general level of prices. When inflation is 3 %, a basket of goods and services that cost 100 dollars last year costs about 103 dollars this year, and each dollar buys about 3 % less. For most of the period from the early 1990s to 2020, inflation in Canada and the United States stayed close to 2 % and attracted little public attention. Then, in 2021 and 2022, it surged to the highest rates in four decades, and cost of living became a dominant political issue. In 2026 an oil price shock pushed headline inflation up again. This lesson explains how inflation is measured, why the measures differ, what inflation costs, and what the 2021–2023 episode taught economists.
Price indexes
A price index measures the cost of a fixed basket of goods and services relative to its cost in a base period. The most widely watched is the consumer price index (CPI), which tracks the prices that households pay. To build it, a statistical agency first surveys household spending to decide what goes into the basket and how much weight each item gets. Shelter might be weighted at about a quarter or more of the basket, food at about a sixth, transportation at about a sixth, and so on. Each month, price collectors record the prices of thousands of specific items across the country. The agency then calculates the cost of the basket at current prices, divides by its cost in the base period, and multiplies by 100.
The inflation rate is the percentage change in the price index, usually measured over twelve months to avoid seasonal patterns. If the CPI rises from 160.0 to 164.8 over a year, the inflation rate is \( (164.8 - 160.0) \div 160.0 \times 100 = 3.0 \) %. Monthly changes are often reported too, sometimes after seasonal adjustment, and can be annualized in the same way as quarterly GDP growth.
Worked problem
Building a simple CPI
A basket contains 10 kg of food, 1 month of rent and 60 liters of gasoline. In the base year the prices are 6 dollars per kg, 1,500 dollars per month and 1.50 dollars per liter. This year they are 6.30 dollars, 1,560 dollars and 1.80 dollars. Calculate the CPI and the inflation rate.
Show solution
- Base-year cost = 10 × 6 + 1,500 + 60 × 1.50 = 60 + 1,500 + 90 = 1,650.
- Current cost = 10 × 6.30 + 1,560 + 60 × 1.80 = 63 + 1,560 + 108 = 1,731.
- CPI = 1,731 ÷ 1,650 × 100 = 104.9.
- Inflation = 4.9 %.
Answer: The basket costs 4.9 % more. Gasoline rose 20 % but has a small weight; rent rose 4 % and has a large weight, so rent drives most of the increase.
# CPI from a weighted basket and item contributions to inflation
basket = {  # item: (quantity, base price, current price)
    'Food (kg)':        (10, 6.00, 6.30),
    'Rent (months)':    (1, 1500.00, 1560.00),
    'Gasoline (L)':       (60, 1.50, 1.80),
}
base = sum(q * p0 for q, p0, p1 in basket.values())
now = sum(q * p1 for q, p0, p1 in basket.values())
cpi = now / base * 100
print(f"Base cost {base:,.2f}  current cost {now:,.2f}  CPI {cpi:.1f}  inflation {cpi - 100:.1f} %")
for item, (q, p0, p1) in basket.items():
    weight = q * p0 / base
    change = p1 / p0 - 1
    print(f"  {item:18s} weight {weight * 100:5.1f} %  price change {change * 100:5.1f} %  "
f"contribution {weight * change * 100:4.2f} pts")Base cost 1,650.00 current cost 1,731.00 CPI 104.9 inflation 4.9 % Food (kg) weight 3.6 % price change 5.0 % contribution 0.18 pts Rent (months) weight 90.9 % price change 4.0 % contribution 3.64 pts Gasoline (L) weight 5.5 % price change 20.0 % contribution 1.09 pts
The contributions add up to the overall inflation rate. Agencies publish similar breakdowns, which is how analysts can say, for example, that gasoline accounted for most of the rise in inflation in a given month.
The Bureau of Labor Statistics publishes the CPI monthly. The most common version, CPI-U, covers all urban consumers, about 90 % of the population. Basket weights are updated every year based on the Consumer Expenditure Surveys. Shelter is the largest component; for homeowners, the BLS uses owners' equivalent rent, an estimate of what owners would pay to rent their own homes, rather than mortgage payments or house prices.
Core inflation and other measures
Headline CPI inflation can swing sharply because of volatile items such as gasoline and fresh food, whose prices respond to weather, wars and global commodity markets. Central banks therefore watch measures of core inflation that strip out or down-weight volatile components and give a better signal of underlying inflation pressure.
In the United States, core CPI excludes food and energy. The Federal Reserve's official inflation goal, however, is defined in terms of the personal consumption expenditures (PCE) price index published by the BEA, which covers a broader range of spending (including spending on behalf of households, such as employer-paid health insurance) and updates its weights continuously. PCE inflation usually runs a few tenths of a percentage point below CPI inflation. In September 2026, headline CPI inflation was 3.7 %, well above core inflation, because of the jump in gasoline prices.
| Measure | Covers | Typical use |
|---|---|---|
| Consumer price index (CPI) | Fixed basket of household purchases | Headline inflation; indexing pensions and tax brackets |
| Core CPI measures | CPI with volatile items removed or trimmed | Underlying inflation for monetary policy |
| GDP deflator | All goods and services in GDP, including investment and exports | Broad price level; converting nominal GDP to real |
| PCE price index (US) | Personal consumption, with changing weights | Federal Reserve inflation goal |
| Producer price indexes | Prices received by producers | Early signal of cost pressures |
The CPI and the GDP deflator differ in two main ways. The deflator covers all domestically produced goods and services, including capital goods and government services, while the CPI covers consumer purchases, including imports. So a rise in the price of imported cars raises the CPI but not the deflator, and a rise in the price of exported oil raises the deflator more than the CPI. And the CPI uses a fixed basket, while the deflator's weights reflect current production.
Is the CPI biased?
For decades economists have argued that a fixed-basket CPI tends to overstate increases in the cost of living. Substitution bias arises because consumers switch toward goods that have become relatively cheaper, but a fixed basket assumes they keep buying the same quantities. Quality bias arises when products improve: if a new phone costs the same as last year's but is faster and has a better camera, part of what looks like an unchanged price is really a price cut. New goods bias arises because new products enter the basket only after a delay, missing the early price declines and the gains to consumers from their availability. Outlet bias arises when consumers shift to discount stores and online sellers. A US commission led by Michael Boskin estimated in 1996 that these biases overstated inflation by about 1.1 percentage points a year; since then, agencies have adopted quality adjustments, more frequent basket updates and chained indexes, and the remaining bias is generally thought to be smaller, perhaps around half a point.
On the other hand, many households feel that official inflation understates their own experience. This is partly because frequently purchased items such as groceries and gasoline loom large in perception, partly because individual baskets differ from the average (renters, homeowners with new mortgages, and older people all face different price changes), and partly because people often compare current prices with those of several years ago rather than last year. The cumulative rise in the price level since 2020, around a fifth in both countries, has not been reversed even though inflation has come down. Lower inflation means prices are rising more slowly, not that they are falling.
Using price indexes: real values
Price indexes let us compare money amounts across time. To convert a dollar amount from year A into year B dollars, multiply by the ratio of the price index in year B to that in year A. A real wage is a nominal wage adjusted for inflation. If your hourly wage rose from 25 dollars to 26.50 dollars (a 6 % increase) while prices rose 4 %, your real wage rose by about 2 %; precisely, 1.06 ÷ 1.04 − 1 = 1.9 %.
Worked problem
Comparing wages across years
In 2019 a worker earned 22.00 dollars an hour when the CPI was 136.0. In 2026 she earns 27.00 dollars and the CPI is 165.0. Did her real wage rise?
Show solution
- Express the 2019 wage in 2026 dollars: 22.00 × 165.0 ÷ 136.0 = 26.69 dollars.
- Her 2026 wage of 27.00 dollars is slightly higher.
- Real wage growth = 27.00 ÷ 26.69 − 1 = 1.2 % over seven years.
Answer: Her real wage rose only about 1.2 % in total, even though her nominal wage rose 22.7 %. Most of the raise simply kept pace with inflation.
Indexing ties payments to a price index so that their real value is preserved.
In the United States, Social Security benefits receive an annual cost-of-living adjustment based on a version of the CPI for wage earners, and federal income tax brackets are indexed using the chained CPI, which grows a little more slowly. Treasury Inflation-Protected Securities (TIPS) pay interest and principal that rise with the CPI.
Why inflation is costly
Moderate, predictable inflation is less harmful than many people believe, but high or unpredictable inflation imposes real costs. Shoe-leather costs are the resources spent minimizing cash holdings when money loses value quickly. Menu costs are the costs of changing prices frequently. Relative-price distortions arise because firms change prices at different times, so prices give misleading signals about relative scarcity. Tax distortions arise because tax systems are often based on nominal values: a capital gain that merely reflects inflation is still taxed, raising the effective tax on saving. Unexpected inflation redistributes wealth from lenders to borrowers, because loans are repaid in dollars that buy less than expected, and it hurts people on fixed nominal incomes. And high inflation creates uncertainty that makes long-term planning and contracting harder, discouraging investment.
Deflation, a sustained fall in the price level, is also costly. It raises the real burden of debts, can lead consumers to postpone purchases in expectation of lower prices, and limits central banks' ability to cut real interest rates when nominal rates are already near zero. Japan's experience with mild deflation from the late 1990s to the early 2010s is the standard cautionary example. This is one reason central banks aim for low positive inflation, typically 2 %, rather than zero.
Very high inflation, called hyperinflation (conventionally, more than 50 % a month), is almost always caused by governments printing money to finance large deficits. Germany in 1923, Zimbabwe in 2008 and Venezuela in the late 2010s are well-known cases. In these episodes, money loses its usefulness as a store of value and unit of account, and economic life is badly disrupted. Lesson 7 explains the link between money growth and inflation.
The inflation surge of 2021–2023
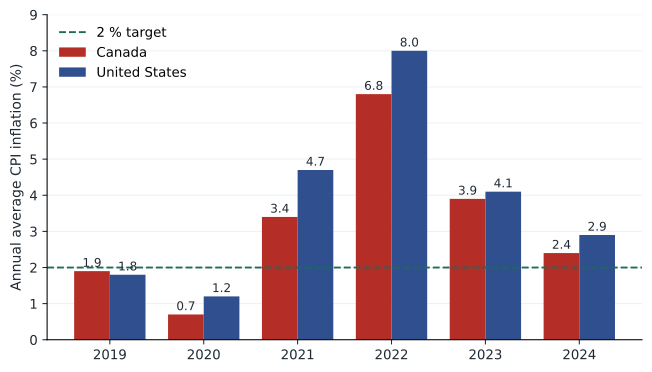
After the pandemic recession of 2020, inflation rose rapidly. In June 2022 twelve-month CPI inflation peaked at 8.1 % in Canada and 9.1 % in the United States, the highest since the early 1980s. Economists identify several causes, and still debate their relative importance. On the supply side, pandemic disruptions snarled global supply chains, shipping costs soared, semiconductor shortages limited car production, and Russia's invasion of Ukraine in February 2022 pushed up energy and food prices. On the demand side, large government support programs and very low interest rates boosted spending, and consumers shifted spending from services toward goods just when goods were hardest to supply. Labor markets became very tight, with job vacancies at record highs. Many economists now conclude that the combination of strong demand and constrained supply was what produced such high inflation; neither alone would have done it.
Inflation then fell. Supply chains recovered, energy prices eased, and central banks raised interest rates rapidly: the Bank of Canada from 0.25 % to 5 % between March 2022 and July 2023, and the Federal Reserve from near zero to a range of 5.25–5.50 % over a similar period. By 2024 inflation was back near target in both countries. Unusually, disinflation occurred without a recession and with only a modest rise in unemployment, an outcome sometimes described as a soft landing. Lessons 8, 9 and 12 examine the policy decisions in more detail.
In 2026 a new shock hit. After war broke out between the United States and Iran in late February 2026, oil prices rose sharply, with Brent crude spending long periods above 100 US dollars a barrel. Gasoline prices jumped by more than a quarter over the year, and headline inflation rose above 3 % in both countries. Central banks faced a classic dilemma, discussed in lesson 9: an oil shock raises prices while also weakening growth.
Common mistakes
MistakeLower inflation means prices are falling.
InsteadLower inflation means prices are rising more slowly; falling prices is deflation.
MistakeThe CPI measures the cost of living exactly.
InsteadIt is a fixed-basket approximation subject to substitution, quality and new-goods biases, and it reflects an average household.
MistakeA 5 % raise during 4 % inflation is a 5 % improvement in living standards.
InsteadThe real wage rises only about 1 %.
MistakeZero inflation is the ideal target.
InsteadCentral banks aim for about 2 % to allow for measurement bias and to avoid deflation and the zero lower bound.
MistakeInflation always comes from greedy firms or workers.
InsteadSustained inflation reflects aggregate demand pressures, supply shocks and expectations, which policy can influence.
Summary and key terms
- Inflation is a sustained rise in the general price level, measured as the percentage change in a price index.
- The CPI measures the cost of a fixed basket of consumer purchases relative to a base period.
- Core measures strip out volatile items to reveal underlying inflation; the US Federal Reserve targets PCE inflation.
- Fixed-basket indexes tend to overstate cost-of-living increases because of substitution, quality and new-goods biases.
- Price indexes convert nominal values into real values and are used to index pensions, benefits and tax brackets.
- High or unpredictable inflation distorts prices, taxes and contracts; deflation is also harmful.
- The 2021–2023 surge reflected strong demand meeting constrained supply; inflation fell as supply recovered and rates rose; a 2026 oil shock raised headline inflation again.
- Inflation
- A sustained rise in the general level of prices.
- Consumer price index (CPI)
- An index of the cost of a fixed basket of consumer goods and services.
- Core inflation
- Inflation excluding or trimming volatile components.
- Deflation
- A sustained fall in the general price level.
- Real wage
- A nominal wage adjusted for changes in the price level.
- Indexing
- Automatic adjustment of payments for inflation.
- Substitution bias
- Overstatement of cost-of-living increases because a fixed basket ignores switching to cheaper goods.
- Hyperinflation
- Extremely rapid inflation, conventionally over 50 % a month.
- Disinflation
- A fall in the rate of inflation.
- Menu costs
- The costs of changing prices.
Practice problems
Work each problem on paper first, then reveal the answer to check.
CPI rises from 150 to 156. What is inflation?
Show answer
4 %.
A basket cost 800 dollars in the base year and 860 dollars now. What is the CPI?
Show answer
107.5.
Why do central banks watch core inflation?
Show answer
Volatile items obscure underlying inflation pressure.
Name three sources of bias in the CPI.
Show answer
Substitution, quality change, new goods, outlet bias.
Your wage rises 3 % while inflation is 5 %. What happens to your real wage?
Show answer
It falls by about 2 % (1.03 ÷ 1.05 − 1 = −1.9 %).
A 1990 price of 50 dollars when the CPI was 80; CPI now 165. Convert to today's dollars.
Show answer
50 × 165 ÷ 80 = 103.13 dollars.
Who gains from unexpected inflation?
Show answer
Borrowers with fixed nominal debts.
Why is deflation dangerous?
Show answer
It raises real debt burdens, may delay spending and limits interest rate cuts.
Give two causes of the 2021–2022 inflation surge.
Show answer
Supply chain disruptions, energy shocks, strong demand from fiscal support and low rates, tight labor markets.
Portfolio task: find the latest CPI release and identify the three components that contributed most to the change in inflation.
Show answer
Answers vary; should cite the official release.
Lesson quiz · 5 questions
Score 60% or more to complete this lesson.
Create a free account to save your progress, take quizzes and earn a certificate.