
DCE-499 · Lesson 11 of 12 · 24 min
Cost estimate, schedule and risk
A design that works technically but cannot be built within the client's budget and schedule is not a successful design. Data center clients make investment decisions measured in hundreds of millions of dollars, and they need a credible estimate of what the campus will cost, how long it will take, and how confident the team is in those numbers. At the concept stage, information is incomplete, so estimates carry wide ranges and the schedule depends on assumptions about utility connections, permits and equipment deliveries. This lesson covers estimating methods and classes, the cost breakdown of a data center, a Class 4 estimate for Aurora phase 1 with a probabilistic range, the main schedule drivers and critical path, procurement strategies for long-lead equipment, the project risk register, value engineering, and life cycle cost.
Estimating methods and classes
Estimates mature as design develops. At the earliest stage, parametric estimates use cost per megawatt of IT capacity or per square meter from comparable projects, adjusted for location, density, redundancy and time. As design progresses, estimates are built from assemblies (for example a power block, a chiller plant, a data hall shell) and eventually from detailed quantities and unit rates. The AACE International classification describes five classes, from Class 5 (concept screening, roughly −20 % to −50 % and +30 % to +100 %) to Class 1 (detailed, roughly −3 % to −10 % and +3 % to +15 %). A schematic design such as the capstone typically supports a Class 4 estimate.
Benchmarks for data center construction cost vary widely by market, density, redundancy and scope, but recent large projects have often fallen in the range of roughly 10 to 15 million dollars per megawatt of IT capacity for powered shell and infrastructure, excluding IT equipment. AI-focused facilities with liquid cooling and high-density power can be higher. Location factors, labor rates, tariffs on imported equipment, exchange rates and market demand for electrical equipment all affect costs, and escalation must be applied from the estimate date to the midpoint of construction.
In the United States, estimates should account for regional labor rates and union agreements, state and local sales tax exemptions on data center equipment where available, tariffs on imported electrical equipment and steel, and prevailing wage requirements where public incentives apply.
Cost breakdown and the phase 1 estimate
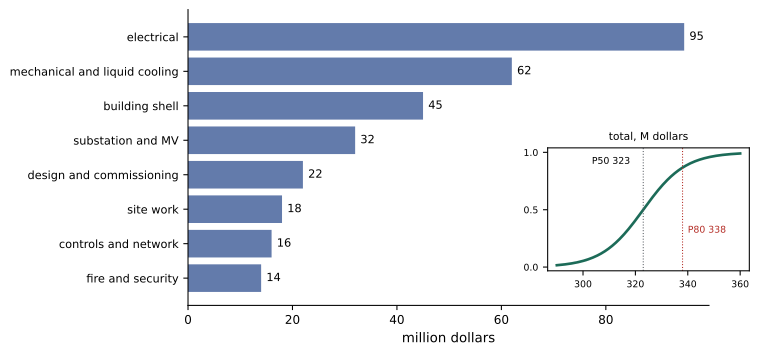
Electrical systems are typically the largest share of data center cost, followed by mechanical systems and the building. The Aurora team's Class 4 estimate for phase 1 assigns a base value and a range to each major element, then combines them with a Monte Carlo simulation that includes a shared market factor, since labor and material prices tend to move together.
import numpy as np
# Class 4 cost estimate for phase 1 (24 MW) with ranges and a Monte Carlo roll-up
items = {  # base estimate in million dollars, low and high factors
    "site work and utilities": (18, 0.85, 1.40),
    "substation and MV distribution": (32, 0.90, 1.35),
    "building shell and structure": (45, 0.90, 1.25),
    "electrical: UPS, generators, LV": (95, 0.90, 1.30),
    "mechanical and liquid cooling": (62, 0.85, 1.35),
    "fire protection and security": (14, 0.90, 1.25),
    "controls, network infrastructure": (16, 0.85, 1.30),
    "design, permits, commissioning": (22, 0.95, 1.20),
}
base = sum(v[0] for v in items.values())
mw = 24
print(f"base estimate {base} M dollars = {base / mw:.1f} M per MW of IT capacity")
for name, (b, lo, hi) in items.items():
    print(f"  {name:34s} {b:4d}  ({b / base:.0%})")

rng = np.random.default_rng(11)
n = 100_000
common = rng.normal(1.0, 0.04, n)      # shared market factor for labor and materials
total = np.zeros(n)
for b, lo, hi in items.values():
    total += b * rng.triangular(lo, 1.0, hi, n) * common
p10, p50, p80, p90 = np.percentile(total, [10, 50, 80, 90])
print(f"P10 {p10:.0f}  P50 {p50:.0f}  P80 {p80:.0f}  P90 {p90:.0f} M dollars")
print(f"contingency to reach P80: {p80 - base:.0f} M ({(p80 - base) / base:.0%} of base)")base estimate 304 M dollars = 12.7 M per MW of IT capacity site work and utilities 18 (6%) substation and MV distribution 32 (11%) building shell and structure 45 (15%) electrical: UPS, generators, LV 95 (31%) mechanical and liquid cooling 62 (20%) fire protection and security 14 (5%) controls, network infrastructure 16 (5%) design, permits, commissioning 22 (7%) P10 301 P50 323 P80 338 P90 346 M dollars contingency to reach P80: 34 M (11% of base)
The base estimate of about 304 million dollars, or roughly 12.7 million dollars per megawatt, sits in the expected range for a mixed air and liquid cooled facility. Because the ranges are skewed upward (overruns are more likely than savings at this stage), the median outcome is above the base, and a contingency of about 11 % is needed to reach 80 % confidence. The team reports the estimate as a range with stated confidence levels, lists the main assumptions and exclusions (for example, IT equipment, land purchase, utility contributions beyond the substation, and financing costs), and identifies the elements contributing most to uncertainty, which here are electrical and mechanical equipment.
Schedule drivers and critical path
The brief asks for phase 1 to be ready for customer fit-out within 30 months of site acquisition. The main schedule drivers are:
- Utility connection: substation design, equipment procurement, construction and energization, which commonly takes two to four years and may be the longest path.
- Permits: rezoning, site plan, air permits and building permits (Lesson 3).
- Long-lead equipment: large power transformers, medium-voltage switchgear, generators, UPS systems and chillers, with lead times that have ranged from many months to several years during periods of high demand.
- Construction: earthworks, foundations, structure, envelope, then mechanical and electrical installation, which proceeds in parallel across halls.
- Commissioning: levels 1 to 5, with integrated systems testing taking several weeks per phase.
A critical path method (CPM) schedule links activities by their dependencies and identifies the longest path, which determines the earliest completion. Activities on the critical path have no float: any delay to them delays the project. The concept schedule should show the critical path and the float on other major paths, so the client can see where acceleration or risk mitigation will matter.
Worked problem
Finding the critical path
Simplified phase 1 paths (months from site acquisition): (A) permits 16, then construction of shell and MEP 12, then commissioning 3; (B) utility substation 28, then energization and backfeed 1, then commissioning 3; (C) transformer and generator procurement 18, then installation 4, then commissioning 3. What is the critical path, and does it meet 30 months?
Show solution
- Path A: 16 + 12 + 3 = 31 months.
- Path B: 28 + 1 + 3 = 32 months.
- Path C: 18 + 4 + 3 = 25 months.
- The critical path is B (utility substation) at 32 months, two months over the target; path A is close behind at 31 months.
Answer: The utility substation is critical. Options include early utility agreements and funding commitments, owner procurement of substation transformers, temporary power for commissioning, or phased energization. Path A must also be shortened by a month, for example through early works permits.
Procurement strategies
To protect the schedule, data center owners increasingly procure long-lead equipment directly and early, sometimes before design is complete, through framework agreements with manufacturers that reserve production slots. Standardized designs across projects allow bulk purchasing and faster delivery. Owner-furnished equipment must be clearly coordinated with contractors' scopes: who receives, stores, installs, tests and warrants it. Procurement strategies interact with delivery models (DCE-470): design-build and construction management at risk allow earlier contractor involvement and procurement, while design-bid-build typically delays procurement until design is complete.
The risk register
The concept-stage risk register identifies the main threats and opportunities, their probability and impact, the response, and the owner. Typical top risks for Aurora include:
- Utility substation delay or cost increase.
- Rezoning or air permit delays or conditions.
- Long-lead equipment delivery delays or price increases, including tariffs.
- Change in customer mix toward higher-density AI, requiring design changes.
- Geotechnical conditions worse than expected.
- Labor shortages in skilled trades in the region.
- Extreme weather during construction.
- Opportunities: favorable equipment pricing through framework agreements, earlier utility capacity, or incentives.
Quantitative risk analysis on cost and schedule (as in the cost simulation above) sets contingency and float allowances. The register is reviewed regularly and becomes part of the project's management plan as design proceeds.
Value engineering
Value engineering (VE) is a structured review of the design to find ways of delivering the required functions at lower cost or higher value, without compromising requirements. In data centers, VE ideas might include standardizing equipment sizes across blocks, reducing redundancy where the brief does not require it, using warmer water temperatures to eliminate chillers in liquid-cooled halls, simplifying building envelope materials, or prefabricating electrical rooms. Each idea is evaluated for cost, schedule, risk, operations and life cycle effects. VE should not become cost cutting that undermines reliability or maintainability; the basis of design and owner's requirements define what must be preserved.
Life cycle cost
Capital cost is only part of the picture. Over 15 to 20 years, energy costs for a 24 MW phase can exceed its construction cost, and maintenance, staffing, water and equipment replacement add more. Life cycle cost analysis compares design options by the present value of all costs over the facility's life. For example, a cooling option that costs 5 million dollars more to build but saves 0.03 in annualized PUE could save about 0.03 × 24 MW × 8,760 h ≈ 6,300 MWh per year; at 80 dollars per MWh that is about 0.5 million dollars per year, paying back the extra cost in about ten years before discounting. Presenting life cycle cost alongside capital cost helps the client make balanced decisions.
Cash flow and financing
Clients also need to know when money will be spent. A cash flow forecast spreads the estimate over the schedule, typically following an S-curve with early spending on design, permits, land and deposits for long-lead equipment, peak spending during construction, and a tail for commissioning and close-out. Owner pre-purchase of equipment shifts spending earlier. The forecast supports financing decisions and the timing of customer contracts, and it helps identify how much capital is at risk before key approvals such as rezoning are secured, which may influence the order of decisions.
In the capstone package, the cost, schedule and risk section should therefore include the estimate with its ranges and confidence levels, the basis and exclusions of the estimate, a summary schedule with the critical path highlighted, the risk register with owners and responses, and at least one life cycle comparison that supports a key design decision.
Common mistakes
MistakePresenting a single-point estimate at concept stage.
InsteadReport a range with confidence levels, assumptions and exclusions.
MistakeIgnoring escalation and exchange rates.
InsteadEscalate to construction midpoint and account for currency.
MistakeAssuming building construction is the critical path.
InsteadCheck utility, permits and long-lead equipment paths.
MistakeCutting redundancy in value engineering without client approval.
InsteadPreserve requirements and evaluate life cycle effects.
MistakeComparing options on capital cost alone.
InsteadInclude energy, maintenance and replacement in life cycle cost.
Summary and key terms
- Estimates mature from parametric to detailed; the capstone supports a Class 4 estimate.
- Large data centers often cost roughly 10 to 15 million dollars per MW of IT capacity, excluding IT.
- Phase 1 base is about 304 million dollars; about 11 % contingency reaches P80.
- Utility connection, permits and long-lead equipment often drive the critical path.
- Early owner procurement and framework agreements protect schedules.
- The risk register and quantitative analysis set contingency and float.
- Value engineering and life cycle cost analysis balance capital and operating costs.
- Parametric estimate
- An estimate based on cost per unit of capacity or area.
- AACE class
- A category of estimate maturity and accuracy.
- Escalation
- Adjustment for price changes over time.
- Contingency
- An allowance for uncertain costs within the scope.
- Critical path
- The longest sequence of dependent activities.
- Float
- Time an activity can slip without delaying completion.
- Long-lead equipment
- Equipment with extended manufacturing times.
- Framework agreement
- A long-term supply agreement reserving production.
- Value engineering
- Structured review to improve value without losing function.
- Life cycle cost
- The present value of all costs over a facility's life.
Practice problems
Work each problem on paper first, then reveal the answer to check.
What estimate class does a schematic design usually support?
Show answer
Class 4.
What is the cost per MW of a 304 M dollar, 24 MW phase?
Show answer
About 12.7 M dollars per MW.
Why is the P50 above the base estimate?
Show answer
Ranges are skewed upward.
List four schedule drivers.
Show answer
Utility connection, permits, long-lead equipment, construction, commissioning.
Paths take 22, 27 and 25 months. What is the critical path?
Show answer
The 27-month path.
Why do owners procure long-lead equipment early?
Show answer
To secure delivery dates and protect the schedule.
Name three top risks for Aurora.
Show answer
Utility delay, permits, equipment delays, customer mix change, ground conditions, labor.
What distinguishes value engineering from cost cutting?
Show answer
VE preserves required functions and considers life cycle effects.
Saving 0.05 PUE on 24 MW at 80 dollars per MWh saves how much per year?
Show answer
0.05 × 24 × 8,760 × 80 ≈ 0.84 M dollars.
What should accompany a concept estimate?
Show answer
Ranges, confidence levels, assumptions and exclusions.
Lesson quiz · 5 questions
Score 60% or more to complete this lesson.
Create a free account to save your progress, take quizzes and earn a certificate.