
DCE-420 · Lesson 6 of 12 · 28 min
Energy storage and firm clean power portfolios
Lesson 5 explained how data center owners buy renewable energy and why the industry is moving from annual to hourly matching of consumption with clean generation. A data center runs around the clock, while solar produces only by day and wind when the wind blows. Filling the gaps requires storage to move energy in time and firm clean resources that produce whenever needed. This lesson examines storage technologies and their roles, how storage earns value and is accredited for capacity, how to design a portfolio that matches a constant load hour by hour, why the last few percent of matching are so expensive, and how storage and firm resources are contracted.
Storage technologies
| Technology | Typical duration | Round-trip efficiency | Status and notes |
|---|---|---|---|
| Lithium-ion batteries | 1 to 4 hours (some 8) | 85% to 90% | dominant; costs fell steeply; fire safety and degradation to manage |
| Flow batteries (vanadium, others) | 4 to 12 hours | 65% to 80% | long cycle life; higher cost; growing deployment |
| Iron-air and other multi-day batteries | 50 to 100+ hours | 40% to 60% | low-cost materials; first commercial projects |
| Pumped hydro | 6 to 20+ hours | 75% to 85% | mature, large scale; needs suitable topography and long development |
| Compressed air | 8 to 24 hours | 50% to 70% | few plants; new adiabatic designs in development |
| Thermal storage | hours to days | varies | chilled water and ice at data centers; high-temperature storage for power in development |
| Hydrogen | days to seasons | 30% to 40% | low efficiency; potentially for seasonal balancing |
For data centers the most relevant today are lithium-ion batteries, at the facility (DCE-340) or on the grid, and contracts with grid-scale storage of various durations. A battery is described by its power rating (MW) and energy capacity (MWh); a 100 MW, 400 MWh battery can deliver 100 MW for four hours. Usable capacity is less than nameplate to protect cell life, and it degrades with cycling and time, typically to 70% to 80% over 10 to 20 years, so contracts specify augmentation (adding cells) to maintain capacity.
How storage earns value
- Energy arbitrage: charging when prices are low (often midday with abundant solar) and discharging when they are high (evening peaks).
- Capacity: counting toward resource adequacy requirements, paid through capacity markets or contracts (Lesson 2).
- Ancillary services: frequency regulation and reserves, which batteries provide very well because of their fast response.
- Shaping renewable contracts: storing midday solar for evening use, converting an intermittent profile into a firmer one.
- Transmission and distribution deferral: relieving a constraint in a few peak hours, delaying an upgrade.
- Backup and flexibility for the customer (Lesson 4).
Worked problem
Arbitrage revenue
A 100 MW, 400 MWh battery with 87% round-trip efficiency cycles once a day, charging at an average of $25/MWh and discharging at an average of $95/MWh. Estimate its annual arbitrage margin over 330 cycling days.
Show solution
- Energy discharged per cycle: 400 MWh; energy charged: \(400/0.87 = 460\) MWh.
- Margin per cycle: \(400 \times 95 - 460 \times 25 = 38{,}000 - 11{,}500 = \$26{,}500\).
- Annual: \(26{,}500 \times 330 = \$8.7\) million.
Answer: About $8.7 million a year, or roughly $87 per kW-year. Arbitrage spreads vary widely by market and year and tend to shrink as more storage is built, so most projects combine arbitrage with capacity payments or long-term contracts.
Capacity accreditation
How much a storage resource counts toward reliability depends on its duration relative to the length of the system's stress periods. A 4-hour battery covers a short evening peak almost fully, but contributes less when stress periods last longer, as in multi-day winter cold snaps. System operators increasingly accredit resources by effective load carrying capability (ELCC): the additional load a resource allows the system to serve at the same reliability. ELCC values for 4-hour batteries are high when few are installed and fall as more are added, because each additional battery shifts the remaining stress to longer periods. Solar's ELCC falls similarly as its share grows, while firm resources such as nuclear, geothermal and gas keep high accreditation (adjusted for outage rates and, for gas, fuel supply risk in winter).
Worked problem
Accredited capacity of a portfolio
A data center owner contracts 300 MW of solar (ELCC 10%), 200 MW of wind (ELCC 15%), and 100 MW of 4-hour storage (ELCC 70%). How much accredited capacity does this portfolio provide toward a 100 MW peak obligation plus 15% reserve?
Show solution
- Accredited: \(300 \times 0.10 + 200 \times 0.15 + 100 \times 0.70 = 30 + 30 + 70 = 130\) MW.
- Requirement: \(100 \times 1.15 = 115\) MW.
Answer: 130 MW, enough for the requirement, with storage providing more than half of the accredited capacity despite being the smallest resource by nameplate. In a system with more storage installed, the battery's ELCC might fall to 50%, leaving the portfolio short.
Designing a 24/7 clean energy portfolio
The hourly carbon-free energy (CFE) score (Lesson 5) measures the share of each hour's consumption matched by clean generation in that hour. For a constant data center load, achieving a high score requires resources whose output fills different hours:
import numpy as np

rng = np.random.default_rng(5)
h = np.arange(8760); day = h // 24; hr = h % 24
load = np.full(8760, 100.0)                                        # flat 100 MW data centre
season = 0.75 + 0.25 * np.cos(2 * np.pi * (day - 172) / 365)
cloud = np.repeat(rng.uniform(0.4, 1.0, 365), 24)
solar = np.clip(np.sin(np.pi * (hr - 6) / 12), 0, None) * season * cloud     # per MW of capacity
w = np.zeros(8760); x = 0.0
for t in range(8760):                                               # wind: slowly varying random process
    x = 0.97 * x + rng.normal(0, 0.12); w[t] = x
wind = np.clip(0.38 + 0.3 * w + 0.08 * np.cos(2 * np.pi * (day - 15) / 365), 0, 1)

def cfe(sol_mw, wind_mw, batt_mw=0, batt_h=4, firm_mw=0):
    gen = sol_mw * solar + wind_mw * wind + firm_mw
    soc, cap, served = 0.0, batt_mw * batt_h, 0.0
    for t in range(8760):
        surplus = gen[t] - load[t]
        if surplus > 0:
            soc = min(cap, soc + min(surplus, batt_mw) * 0.9); served += load[t]
        else:
            d = min(-surplus, batt_mw, soc); soc -= d; served += gen[t] + d
    return served / load.sum(), gen.sum() / load.sum()

for label, args in (("solar 300 MW", (300, 0)), ("solar 150 + wind 200 MW", (150, 200)),
                    ("solar 150 + wind 200 + 100 MW x 4 h battery", (150, 200, 100, 4)),
                    ("solar 150 + wind 200 + battery + 40 MW firm clean", (150, 200, 100, 4, 40))):
    score, vol = cfe(*args)
print(f"{label:50s}: hourly CFE {score:5.1%}, annual volume {vol:5.1%} of load")solar 300 MW : hourly CFE 37.0%, annual volume 49.1% of load solar 150 + wind 200 MW : hourly CFE 85.5%, annual volume 106.4% of load solar 150 + wind 200 + 100 MW x 4 h battery : hourly CFE 91.7%, annual volume 106.4% of load solar 150 + wind 200 + battery + 40 MW firm clean : hourly CFE 99.5%, annual volume 146.4% of load
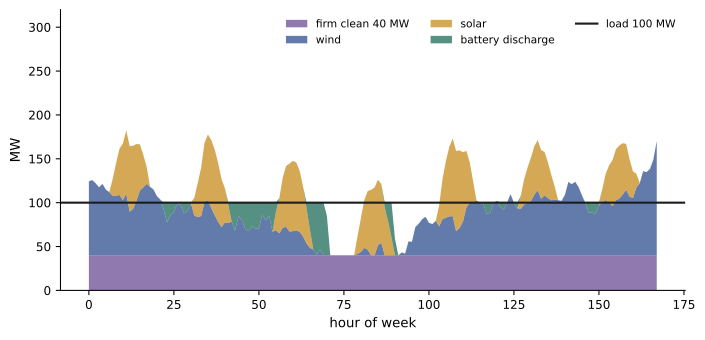
Solar alone, even at three times the load's capacity, matches only about 37% of hours: it produces nothing at night, and its midday surplus is wasted without storage. Combining solar and wind, with slightly more annual energy than the load consumes, raises the score to about 85%. A 4-hour battery adds several points by moving midday surplus into the evening. Closing the remaining gap, the calm nights and winter weeks when neither solar nor wind produces, takes firm clean power: adding 40 MW of round-the-clock clean supply reaches over 99%, but the portfolio then produces 46% more energy than the load uses over the year, much of it surplus sold back to the grid.
This pattern is general: the cost of each additional percentage point of hourly matching rises steeply above roughly 80% to 90%, because the last hours to be filled are the longest, rarest gaps. Studies of 24/7 procurement find that firm clean resources (nuclear, geothermal, hydro, and in future long-duration storage or gas with carbon capture) greatly reduce the cost of very high matching compared with overbuilding solar, wind and short-duration batteries.
Worked problem
The cost of the last few percent
For the same load, a consultant estimates portfolio costs of $55/MWh of load for 85% CFE, $68/MWh for 92% and $95/MWh for 99%. What is the marginal cost per additional MWh matched between 92% and 99%?
Show solution
- Annual load: \(100 \times 8{,}760 = 876{,}000\) MWh.
- Extra cost: \((95 - 68) \times 876{,}000 = \$23.7\) million per year.
- Extra matched energy: \((0.99 - 0.92) \times 876{,}000 = 61{,}320\) MWh.
- Marginal cost: \(23.7\text{M}/61{,}320 = \$386\)/MWh matched.
Answer: About $386 per additional MWh matched, several times the average cost. Owners weigh such marginal costs against the value of their climate commitments, and often aim for 90% or more hourly matching by a target year, relying on firm clean resources and grid decarbonization for the remainder.
Where the clean energy is: location and deliverability
Hourly matching credibility also depends on location. A clean generator that is not deliverable to the data center's grid region, because of transmission constraints, does not displace fossil generation serving the data center in that hour. Emerging standards for hourly accounting therefore require resources to be in the same grid region (or with demonstrated deliverability), and emphasize additionality: new resources that would not otherwise have been built. Proposed revisions to the Greenhouse Gas Protocol's Scope 2 guidance move in this direction, which would change how many current procurement claims are counted.
Contracting for storage and firm power
- Hybrid PPAs: a renewable project paired with storage delivers a shaped or firmed profile, priced as a single contract.
- Tolling agreements: the buyer pays a fixed capacity fee for the right to charge and discharge a storage facility as it chooses, taking the market risk and reward.
- Capacity contracts or resource adequacy agreements: payments for accredited capacity without energy dispatch rights.
- Firm clean energy contracts: long-term agreements with nuclear plants (including restarts and uprates), geothermal developers or hydro utilities, often at premium prices reflecting their round-the-clock value (Lesson 10).
- Utility clean transition tariffs: tariffs, offered by some utilities, under which large customers pay for specific new clean firm resources on the utility system, combining the utility's grid operations with customer-funded procurement.
The data center owner's choice among these depends on whether it wants financial exposure to market prices, physical firmness, or simply credible hourly matching, and on what its local market and regulators allow.
Common mistakes
MistakeTreating annual renewable volume as equivalent to round-the-clock supply.
InsteadMeasure hourly matching; solar-heavy portfolios leave large night-time gaps.
MistakeCounting battery nameplate as firm capacity.
InsteadUse ELCC accreditation, which falls as storage penetration grows and with longer stress periods.
MistakeIgnoring battery degradation in long contracts.
InsteadSpecify augmentation or capacity guarantees.
MistakePursuing the last percent of matching with ever more solar and wind.
InsteadUse firm clean resources and long-duration storage for the longest gaps.
MistakeContracting clean energy that cannot be delivered to the load's grid region.
InsteadCheck deliverability and regional rules for hourly claims.
Summary and key terms
- Storage ranges from lithium-ion batteries of a few hours to multi-day and seasonal technologies.
- Storage earns value from arbitrage, capacity, ancillary services, shaping and deferral.
- Capacity accreditation by ELCC depends on duration and penetration.
- Diverse portfolios of solar, wind, storage and firm clean power raise hourly CFE scores.
- Costs rise steeply above about 80% to 90% matching; firm clean resources reduce the cost of the last gaps.
- Hybrid PPAs, tolling, capacity and firm clean contracts, and utility tariffs procure storage and firmness.
- Round-trip efficiency
- Energy discharged divided by energy charged.
- Duration
- Energy capacity divided by power rating.
- Augmentation
- Adding battery capacity over time to offset degradation.
- Arbitrage
- Buying energy when cheap and selling when expensive.
- ELCC
- Effective load carrying capability, the reliability contribution of a resource.
- CFE score
- The share of hourly consumption matched by clean generation in the same hour.
- Firm clean power
- Carbon-free generation available on demand, such as nuclear or geothermal.
- Long-duration storage
- Storage able to discharge for roughly 10 hours or more.
- Tolling agreement
- A contract paying for the right to operate a storage or generating facility.
- Deliverability
- Whether generation can physically reach the load's grid region.
Practice problems
Work each problem on paper first, then reveal the answer to check.
Duration of a 50 MW, 200 MWh battery?
Show answer
4 hours.
Energy charged to discharge 200 MWh at 85% efficiency?
Show answer
235 MWh.
Arbitrage margin for that cycle at $20 charge and $90 discharge?
Show answer
\(18{,}000 - 4{,}706 = \$13{,}300\).
Why does battery ELCC fall as more batteries are added?
Show answer
Remaining stress periods become longer than the battery duration.
Accredited capacity of 200 MW solar at 12% and 50 MW storage at 80%?
Show answer
64 MW.
Why does solar alone give a low hourly CFE score for a constant load?
Show answer
It produces nothing at night.
A portfolio produces 120% of annual load but matches 88% of hours. Why the difference?
Show answer
Surplus generation in some hours cannot cover gaps in others without storage.
Name two firm clean resources.
Show answer
Nuclear, geothermal, hydro (and gas with carbon capture).
What is a tolling agreement?
Show answer
A fixed payment for the right to operate a facility and take its market revenues.
What does additionality mean in clean energy procurement?
Show answer
The purchase causes new clean generation that would not otherwise exist.
Lesson quiz · 5 questions
Score 60% or more to complete this lesson.
Create a free account to save your progress, take quizzes and earn a certificate.