
DCE-420 · Lesson 5 of 12 · 35 min
Renewables and power purchase agreements
The largest data center operators are also the largest corporate buyers of renewable energy in the world. Amazon, Microsoft, Meta and Google together have contracted tens of gigawatts of wind, solar and other clean generation, driven by climate commitments, customer expectations and, increasingly, the economics of long-term fixed-price contracts. This lesson explains how data centers buy clean electricity: the accounting rules for claiming it, the instruments available (certificates, utility programs and power purchase agreements), the risks in those contracts, the move from annual to hourly matching, and the policy incentives that shape the market.
Carbon accounting for electricity
Greenhouse gas emissions from purchased electricity are reported as Scope 2 emissions under the Greenhouse Gas Protocol. Two methods are required side by side:
- Location-based: consumption multiplied by the average emission factor of the grid where it is used. This reflects the physical grid and can only be reduced by using less energy, locating in cleaner grids, or making the grid itself cleaner.
- Market-based: consumption multiplied by the emission factor of the electricity the company has contracted for, as shown by energy attribute certificates. A company that buys certificates matching all its consumption can report zero market-based emissions.
An energy attribute certificate (EAC) represents the environmental attributes of 1 MWh of generation. In the US these are renewable energy certificates (RECs), tracked through regional registries such as PJM-GATS, ERCOT's REC program, WREGIS and M-RETS. States also use RECs for their renewable portfolio standards (RPS), creating compliance markets alongside the voluntary market used by companies.
Worked problem
Location-based and market-based emissions
A data center in PJM uses 500,000 MWh a year. The grid emission factor is 0.38 t CO₂e/MWh. The operator buys RECs for 400,000 MWh from wind farms. Calculate both Scope 2 figures, assuming the residual mix factor is 0.42 t/MWh.
Show solution
- Location-based: \(500{,}000 \times 0.38 = 190{,}000\) t.
- Market-based: certified 400,000 MWh at zero; remaining 100,000 MWh at the residual mix \(= 100{,}000 \times 0.42 = 42{,}000\) t.
Answer: Location-based 190,000 t; market-based 42,000 t. The residual mix (grid average after removing claimed certificates) is higher than the average because the clean attributes have been claimed by others.
Critics argue that buying cheap unbundled certificates from existing projects far away does little to reduce real emissions. The Greenhouse Gas Protocol has been revising its Scope 2 guidance, with proposals published in 2025 to require hourly matching and that certificates come from the same grid region as consumption, phased in over several years. Leading buyers have moved ahead of the rules, emphasizing additionality (contracts that cause new projects to be built), deliverability and time matching.
Procurement options
From simplest to most involved, data centers can buy clean electricity through:
| Option | How it works | Additionality | Typical use |
|---|---|---|---|
| Unbundled certificates | Buy EACs separately from electricity | Low | Small or residual volumes |
| Green tariffs | Utility procures renewables for the customer under a special tariff | Medium to high | Regulated markets without retail choice |
| Physical PPA | Buy power and certificates from a specific project delivered to the load | High | Where the buyer can take delivery (competitive markets, on-site, or sleeved through a utility) |
| Virtual (financial) PPA | Financial contract for differences plus certificates; power sold into the market | High | Large buyers in organized markets |
| On-site or co-located generation | Generation at or next to the facility | High | Limited by land and load size |
| Equity ownership | Invest in or build the project | High | Largest buyers |
In the US, virtual PPAs dominate corporate procurement in RTO regions, while green tariffs (such as those offered by Duke Energy, Georgia Power, Dominion and NV Energy) and utility-built generation dedicated to large customers are common in vertically integrated states. Some utilities now offer "clean transition tariffs" letting data centers pay for firm clean resources such as geothermal or nuclear.
Virtual PPAs
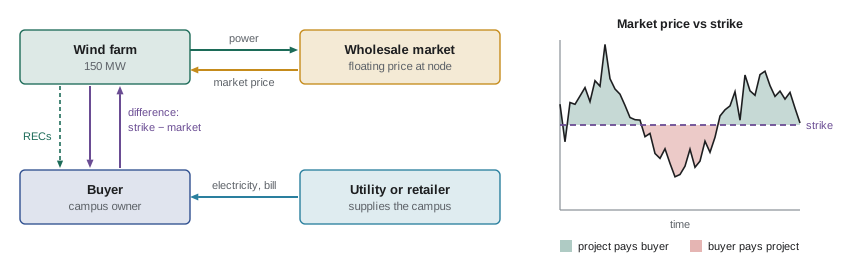
A virtual PPA (VPPA) is a contract for differences. The project sells its output into the wholesale market at the local market price. The buyer and project agree a fixed strike price; for each MWh generated:
- If the market price is below the strike, the buyer pays the project the difference.
- If the market price is above the strike, the project pays the buyer the difference.
The project receives a fixed price per MWh overall, which supports financing, and the buyer receives the certificates. The buyer continues buying its own electricity from its utility or retailer at market-related prices, so when market prices rise, its higher bill is partly offset by VPPA payments it receives, providing a hedge.
Worked problem
VPPA settlement
A buyer signs a VPPA for a 150 MW wind farm at a strike price of $55/MWh. In one month the farm generates 45,000 MWh, realizing an average market price at its node of $38/MWh. In another month it generates 30,000 MWh at an average price of $82/MWh. Calculate the settlements.
Show solution
- Month 1: \(45{,}000 \times (38 - 55) = -\$765{,}000\): the buyer pays the project $765,000.
- Month 2: \(30{,}000 \times (82 - 55) = +\$810{,}000\): the project pays the buyer $810,000.
- Net over the two months: \(+\$45{,}000\) to the buyer.
Answer: The buyer paid in the low-price month and received in the high-price month. Over the contract, its net cost or gain depends on how market prices evolve relative to the strike. It also received 75,000 RECs, which it can retire to cover 75,000 MWh of consumption.
Risks in PPAs
PPAs typically last 10 to 20 years, and buyers take on several risks:
- Price risk: if market prices fall well below the strike for years, the buyer pays continually. Buyers who signed VPPAs in 2019 at $30/MWh have done well; some who signed at higher prices before prices fell did not.
- Shape risk: solar produces mostly at midday and wind often at night. As more renewables are built, prices fall when they produce (cannibalization), so the project's "capture price" is below the average market price. The buyer's settlement is based on the capture price.
- Basis risk: the project settles at its own node or hub, but the buyer's load pays the price at its own location. Congestion can make these differ greatly, so the hedge is imperfect.
- Volume risk: output varies with weather; fixed-shape contracts transfer this risk to the seller at a higher price.
- Negative prices: in hours of surplus, prices can go below zero; contracts specify whether the buyer pays the strike plus the negative price or whether the project curtails.
- Counterparty, development and change-in-law risks: the project may be delayed or fail, the counterparty may default, or rules (such as tax credits) may change.
- Accounting risk: some contracts must be treated as derivatives, marked to market in the buyer's financial statements.
Worked problem
Capture price and cannibalization
A solar project's market has an average annual price of $50/MWh, but the solar-weighted average (capture) price is $36/MWh because prices drop at midday. A VPPA has a strike of $45/MWh and the project produces 300,000 MWh a year. What is the buyer's annual settlement, and what would it be if the project captured the average price?
Show solution
- Actual: \(300{,}000 \times (36 - 45) = -\$2.7\) million (the buyer pays).
- At the average price: \(300{,}000 \times (50 - 45) = +\$1.5\) million.
Answer: Shape alone turns a $1.5 million gain into a $2.7 million cost. Capture rates (capture price divided by average price) of 70 to 80% are common for solar in high-penetration markets, so buyers must model hourly prices, not just averages. Pairing solar with storage improves capture prices.
From annual to hourly matching
Most companies have claimed "100% renewable" by buying certificates equal to their annual consumption, regardless of when the renewables produced. A data center runs around the clock, so a solar-heavy portfolio may cover midday hours many times over while nights are supplied by fossil generation. Google introduced the goal of 24/7 carbon-free energy (CFE): matching consumption with carbon-free generation on the same grid every hour. Its CFE score measures the fraction of hourly consumption matched:
where \(L_h\) is load and \(G_h\) is contracted clean generation (plus the grid's clean share) in hour \(h\). Achieving a high CFE score requires a mix of resources that produce at different times (solar, wind, storage) and, beyond about 80 to 90%, firm clean resources such as hydro, geothermal, nuclear or gas with carbon capture.
Worked problem
Hourly matching for a day
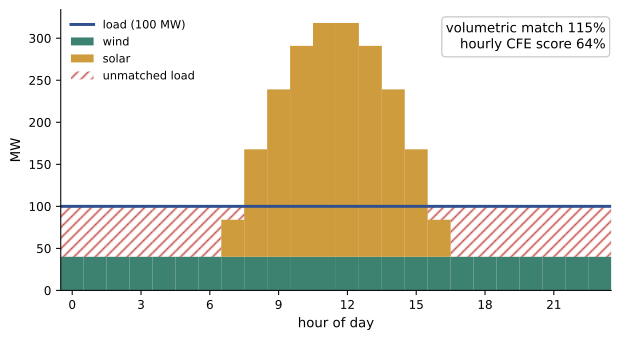
A data center uses a constant 100 MW. Its contracted solar produces 300 MW at midday, giving 1,800 MWh over the day (spread over 10 hours), and its wind produces 40 MW steadily. Estimate the annual-style match and the hourly CFE score for the day, ignoring the grid's clean share.
Show solution
- Consumption: \(100 \times 24 = 2400\) MWh. Generation: \(1800 + 40 \times 24 = 2760\) MWh. Volumetric match \(= 2760/2400 = 115\%\).
- Daylight (10 h): solar plus wind exceeds load, so matched \(= 100 \times 10 = 1000\) MWh.
- Night (14 h): only wind, matched \(= 40 \times 14 = 560\) MWh.
- CFE \(= (1000 + 560)/2400 = 65\%\).
Answer: The portfolio covers 115% of consumption on an annual basis but only 65% hourly. Adding 4-hour storage to shift midday surplus into the evening, more wind, or a firm clean resource would be needed to raise the score.
import numpy as np

# hourly profile for one day: flat load, solar bell curve, steady wind
h = np.arange(24)
load = np.full(24, 100.0)
solar = np.where((h >= 7) & (h < 17), 300 * np.sin(np.pi * (h - 7 + 0.5) / 10), 0)
solar *= 1800 / solar.sum()          # scale to 1800 MWh per day
wind = np.full(24, 40.0)

def cfe(load, gen):
    return np.minimum(load, gen).sum() / load.sum()

print("volumetric match:", round((solar + wind).sum() / load.sum(), 2))
print("CFE solar+wind:  ", round(cfe(load, solar + wind), 3))

# add a 100 MW / 400 MWh battery, 90% round-trip, charging from surplus
def with_storage(load, gen, p=100, e=400, eff=0.9):
    soc = 0.0
    for day in range(2):          # day 2 starts with charge left from day 1
        matched = 0.0
        for t in range(24):
            if gen[t] >= load[t]:
                soc += min(p, (e - soc) / eff, gen[t] - load[t]) * eff
                matched += load[t]
            else:
                dis = min(p, soc, load[t] - gen[t])
                soc -= dis
                matched += gen[t] + dis
    return matched / load.sum()

print("CFE with storage:", round(with_storage(load, solar + wind), 3))volumetric match: 1.15 CFE solar+wind: 0.637 CFE with storage: 0.803
With a realistic solar curve, generation in the early morning and late afternoon falls short of load, so the score is 64% rather than the 65% of the hand estimate. A 100 MW, 400 MWh battery charged from the midday surplus raises it to 80%; the remaining gap is in the night hours, which need more wind, longer storage or a firm resource.
Hourly matching also changes procurement: buyers value resources by when they produce, not just how much, and pay premiums for evening and night generation. Analyses suggest that pursuing 24/7 CFE does more to reduce grid emissions per dollar spent at high match levels than buying surplus annual certificates, because it drives investment in storage and firm clean resources.
Incentives and policy
Federal tax credits have been the main US support for clean electricity, and changed substantially in 2025:
- The Inflation Reduction Act (2022) created technology-neutral production (45Y) and investment (48E) tax credits for zero-emission generation from 2025, worth up to about 30% of capital or a per-MWh credit with bonuses for domestic content and energy communities.
- The One Big Beautiful Bill Act (July 2025) ends these credits early for wind and solar: projects must have begun construction by July 4, 2026, or be placed in service by the end of 2027.
- Storage, geothermal, hydro, nuclear and fuel cells keep the credits longer, phasing down after 2033, but restrictions on components and ownership from "foreign entities of concern" apply from 2026.
The early expiry of wind and solar credits raised PPA prices and pushed developers to start construction before the deadline, while increasing the relative attractiveness of storage, geothermal and nuclear for data center buyers. State renewable portfolio standards, clean energy standards and state-level incentives continue to support clean generation in many states.
Worked problem
Effect of a tax credit on PPA price
A solar project costs $1.20 million per MW and produces 2,000 MWh per MW per year. Its levelized cost of energy (LCOE), using a capital recovery factor of 0.085 and $20,000 per MW-year operating cost, is to be estimated with and without a 30% investment tax credit.
Show solution
- Without credit: annual cost \(= 1.2 \times 10^6 \times 0.085 + 20{,}000 = \$122{,}000\); LCOE \(= 122{,}000/2000 = \$61\)/MWh.
- With a 30% credit, net capital is $0.84 million per MW: annual cost \(= 0.84 \times 10^6 \times 0.085 + 20{,}000 = \$91{,}400\); LCOE \(= 91{,}400/2000 = \$45.7\)/MWh.
Answer: The credit lowers the required PPA price by about $15/MWh, or 25%. Losing it raises PPA prices accordingly, which is why credit deadlines strongly affect procurement timing and prices.
Building a procurement strategy
A data center operator's electricity strategy typically combines:
- Efficiency first: lower PUE and better utilization reduce the amount of energy to buy (DCE-320).
- Location: siting in clean, well-supplied grids lowers location-based emissions (DCE-410).
- A portfolio of contracts: PPAs with different technologies, locations and terms to spread shape, basis and price risk, plus utility programs where markets are not open.
- Storage and flexibility: shifting load or using batteries to improve hourly matching and reduce peak charges.
- Firm clean resources: long-term contracts for nuclear, geothermal, hydro or other firm sources (Lesson 10).
- Transparency: reporting both location- and market-based emissions and hourly matching where possible.
Lesson 6 develops the storage and firm clean resources needed for high hourly matching, and Lesson 9 the PPA terms that determine how much a contract really costs.
Common mistakes
MistakeClaiming that buying annual certificates makes a 24/7 load carbon-free.
InsteadAnnual matching ignores timing; report hourly CFE and location-based emissions too.
MistakeEvaluating a VPPA against the average market price.
InsteadUse the project's capture price at its node, which can be far below average.
MistakeIgnoring basis risk between the project node and the load.
InsteadCongestion can make the hedge ineffective; model both locations.
MistakeForgetting negative-price provisions.
InsteadSpecify curtailment or settlement rules for negative-price hours.
MistakeAssuming tax credits will remain available for the contract's development period.
InsteadInclude change-in-law and credit-qualification provisions, and verify deadlines.
Summary and key terms
- Scope 2 emissions are reported location-based and market-based.
- Energy attribute certificates represent 1 MWh of clean generation's attributes.
- Options range from unbundled certificates to green programs, physical and virtual PPAs, on-site generation and ownership.
- A virtual PPA is a contract for differences around a strike price, plus certificates.
- PPA risks include price, shape, basis, volume, negative prices, counterparty and accounting.
- Capture prices fall as renewables grow, so model hourly prices.
- 24/7 CFE matches clean generation to load each hour, requiring diverse and firm resources.
- IRA credits for wind and solar end early under the 2025 OBBBA; storage, geothermal and nuclear keep them longer.
- Scope 2 emissions
- Indirect emissions from purchased electricity, heat or steam.
- Location-based method
- Scope 2 using average grid emission factors.
- Market-based method
- Scope 2 using contracted instruments and residual mix factors.
- Energy attribute certificate
- A certificate representing the attributes of 1 MWh of generation.
- Residual mix
- Grid emission factor after removing claimed certificates.
- Additionality
- Whether a purchase causes new clean generation to be built.
- Virtual PPA
- A financial contract for differences with certificates.
- Strike price
- The fixed price in a contract for differences.
- Capture price
- The generation-weighted average market price a project receives.
- Basis risk
- Risk from price differences between locations.
- 24/7 CFE
- Matching consumption with carbon-free generation every hour.
Practice problems
Work each problem on paper first, then reveal the answer to check.
A facility uses 200,000 MWh in a grid at 0.12 t/MWh. Location-based emissions?
Show answer
24,000 t CO₂e.
What is additionality?
Show answer
Whether the purchase causes new clean generation to be built that would not otherwise exist.
A VPPA has a strike of $50/MWh. The project produces 20,000 MWh at an average capture price of $42. Settlement?
Show answer
20,000 × (42 − 50) = −$160,000; the buyer pays $160,000.
Why is a solar capture price usually below the average market price?
Show answer
Solar produces when many solar plants produce, depressing prices in those hours.
What is basis risk in a VPPA?
Show answer
The difference between the price at the project's settlement point and at the buyer's load.
A flat 50 MW load is matched 50 MW for 12 hours and 20 MW for 12 hours. CFE score?
Show answer
(600 + 240)/1200 = 70%.
Why are firm clean resources needed for very high CFE scores?
Show answer
Solar, wind and short-duration storage cannot cover all hours, especially long low-wind periods.
Under OBBBA, what deadline applies to wind and solar credits?
Show answer
Begin construction by July 4, 2026, or be placed in service by December 31, 2027.
A project costs $1.5 million/MW, CRF 0.08, O&M $25,000/MW-yr, 3000 MWh/MW-yr. LCOE?
Show answer
(120,000 + 25,000)/3000 = $48.3/MWh.
Name two ways to reduce shape risk.
Show answer
Pair solar with storage; combine wind and solar; contract firm resources; buy fixed-shape products.
Lesson quiz · 5 questions
Score 60% or more to complete this lesson.
Create a free account to save your progress, take quizzes and earn a certificate.