
DCE-410 · Lesson 7 of 12 · 25 min
Water, wastewater and stormwater servicing
Power gets most of the attention in data center siting, but water, wastewater and stormwater can stop a project just as surely. A municipality whose treatment plant is near capacity cannot promise millions of liters a day for evaporative cooling; a site without a stormwater outlet cannot be developed until one is built; and a cooling system that discharges concentrated blowdown may exceed sewer limits. Lesson 5 covered the environmental permits for taking and discharging water. This lesson covers the engineering of servicing: estimating water demand, municipal capacity and fire flow, alternative water sources, wastewater and blowdown, and the design of stormwater management, which every data center site needs regardless of its cooling technology.
How much water does a data center need?
Water demand depends mainly on the cooling technology (DCE-330):
- Evaporative cooling (cooling towers, adiabatic coolers in hot weather) consumes water by evaporation, roughly 1.5 to 2 liters per kWh of heat rejected at full evaporative duty, plus blowdown. Annual water usage effectiveness (WUE) for evaporatively cooled sites is often 1 to 2 L/kWh of IT energy, varying with climate.
- Closed-loop dry coolers and air-cooled chillers use almost no water for cooling, at the cost of higher energy use on hot days and more equipment area and noise.
- Hybrid and adiabatic systems use water only on the hottest days, reducing annual use but not peak demand.
- Domestic use (washrooms, kitchens) is small, comparable to an office building of similar staff.
For servicing, the peak day matters more than the annual average, because water systems are sized for maximum day demand plus fire flow.
Worked problem
Peak day water demand
A 100 MW IT campus uses cooling towers. On a hot design day, the heat rejected is 115 MW (IT plus cooling and electrical losses), evaporation is 1.6 L per kWh of heat rejected, and the towers run at 4 cycles of concentration. Estimate the peak day make-up water and blowdown.
Show solution
- Heat rejected per day: \(115{,}000 \times 24 = 2.76\) million kWh. Evaporation: \(2.76 \times 1.6 = 4.42\) million L.
- Blowdown \(= E/(\text{COC} - 1) = 4.42/3 = 1.47\) million L/day.
- Make-up \(= E + B = 5.89\) million L/day, about 68 L/s.
Answer: About 5.9 million liters per day (1.56 million US gallons per day, 68 L/s) of make-up water and 1.5 million liters per day of blowdown, comparable to the water use of a town of 15,000 to 20,000 people. Few small municipal systems can supply this without major upgrades, which is why water capacity must be confirmed early.
Raising the cycles of concentration reduces blowdown but increases scaling and corrosion risk, managed by water treatment. Pretreatment such as softening allows higher cycles; at very high cycles, blowdown becomes a concentrated stream whose disposal may be more difficult than its volume suggests.
Municipal water servicing
Where the site will connect to a municipal system, the developer requests a servicing capacity assessment. The municipality or its consultant uses a hydraulic model of the distribution network to check whether the system can deliver the requested flow and pressure, considering:
- Treatment plant capacity and allocations already committed to approved developments.
- Source capacity: the permitted taking from rivers, lakes or wells.
- Transmission and distribution mains between the plant and the site, including pressure at peak demand.
- Storage: reservoirs and elevated tanks for peak hour demand and fire reserve.
- Fire flow: the flow the system must provide for firefighting at the site while maintaining minimum pressure elsewhere.
Fire flow for large buildings in the US is commonly determined from the International Fire Code (Appendix B) or Insurance Services Office methods, depending on construction type, floor area and sprinkler protection, with reductions for sprinklered buildings, typically resulting in 1,500 to 4,000 US gallons per minute for large buildings. Minimum residual pressure during fire flow is usually 20 psi.
If the system lacks capacity, the municipality may require the developer to fund upgrades: new or larger watermains, booster stations, storage tanks or treatment expansion, often under a servicing or development agreement with cost-sharing and recovery provisions for later users (Lesson 10). Lead times for treatment plant expansion are measured in years, so a campus may be phased to match.
For fire protection, data centers often install on-site fire water storage tanks and fire pumps, so that sprinkler demand does not depend on the municipal system's pressure, reducing the required municipal fire flow.
Alternative water sources
Concern about water use is a major source of community opposition, especially in dry regions. Developers increasingly reduce demand or use non-potable sources:
- Reclaimed water: treated municipal wastewater supplied through a separate network for cooling. Several data center markets have reclaimed water systems serving data center campuses, sparing drinking water supplies, although reclaimed water needs additional treatment for scaling and biological control.
- Groundwater: private wells with a permit to take water (Lesson 5), supported by a hydrogeological study showing no unacceptable effect on neighboring wells, wetlands or streams.
- Surface water: direct taking from a river or lake, with intake design to protect fish and permits for the taking and any return flow.
- Rainwater harvesting from large roofs, useful as a supplement but rarely enough for peak cooling demand.
- Water-free cooling: closed-loop dry coolers, which have become common for liquid-cooled AI halls whose higher water temperatures (DCE-330) allow dry heat rejection in most climates for most of the year.
Public commitments to water-positive operation, replenishing more water than consumed through watershed projects, are increasingly common, but communities judge projects mainly on local effects.
Wastewater
A data center produces two kinds of wastewater:
- Sanitary sewage from staff facilities, small and conventional.
- Process water: cooling tower blowdown, filter backwash and reject water from reverse osmosis or softening, which can be large and contains concentrated dissolved solids, treatment chemicals and sometimes elevated temperature.
Discharge to a municipal sewer is governed by local pretreatment and sewer use ordinances under the federal pretreatment program, setting limits on temperature, pH, solids, metals and other parameters, and often requiring an industrial user permit with monitoring and surcharges. The publicly owned treatment works must have capacity; if not, the developer may fund upgrades or obtain an NPDES permit for direct discharge after on-site treatment.
Because blowdown is roughly a quarter of make-up water in the example above, wastewater capacity can be as binding as water supply. Some sites use zero-liquid-discharge treatment, evaporating the blowdown and disposing of solids, at considerable cost and energy use.
Stormwater management
Replacing fields or woods with roofs, paving and gravel yards dramatically increases the volume and peak rate of runoff. A data center campus may be 60% to 80% impervious. Without management, the increased runoff causes flooding downstream, erodes stream channels and carries sediment, oils and metals into watercourses. Stormwater management plans address four objectives:
- Quantity: post-development peak flows must not exceed pre-development peaks for a range of design storms, commonly the 2-year to 100-year events.
- Quality: post-construction treatment to remove pollutants, as required by state and local stormwater rules under the municipal separate storm sewer (MS4) program, often expressed as a percentage removal of total suspended solids or phosphorus.
- Volume and erosion: retaining or infiltrating a portion of rainfall (for example, the first 25 mm or 1 inch) and controlling flows in the frequent storms that shape channels.
- Water balance: maintaining infiltration and baseflow to wetlands and streams where they depend on groundwater.
The rational method gives the peak runoff rate for small catchments:
where \(C\) is the runoff coefficient (0.2 to 0.35 for fields, 0.8 to 0.95 for roofs and paving) and \(i\) the rainfall intensity for a duration equal to the time of concentration, from the local intensity-duration-frequency (IDF) curve. Development raises \(C\) and shortens the time of concentration, which raises \(i\), so the peak multiplies.
import numpy as np

# Rational method Q = C i A / 360 (Q in m3/s, i in mm/h, A in ha). IDF curve i = a / (t + b)^c for a 100-year storm.
a, b, c = 2000.0, 8.0, 0.85                            # illustrative IDF coefficients (t in minutes, i in mm/h)
idf = lambda t: a / (t + b) ** c
A = 30.0                                               # drainage area, ha
C_pre, C_post = 0.25, 0.80                             # farmland before; roofs and paving after
tc_pre, tc_post = 40.0, 15.0                           # times of concentration, minutes

Q_pre = C_pre * idf(tc_pre) * A / 360
Q_post = C_post * idf(tc_post) * A / 360
print(f"pre-development peak {Q_pre:.2f} m3/s ({Q_pre * 35.31:.0f} cfs); post-development peak {Q_post:.2f} m3/s ({Q_post * 35.31:.0f} cfs)")

# Modified rational method: storage needed to hold the release rate to the pre-development peak
best = (0, 0)
for t in range(10, 361, 5):                            # storm durations in minutes
    inflow = C_post * idf(t) * A / 360 * t * 60       # runoff volume for a storm of duration t
    outflow = Q_pre * (t + tc_post) * 60 / 2 * 1.0     # release volume, approximating the outflow hydrograph as a trapezoid
    if inflow - outflow > best[0]:
        best = (inflow - outflow, t)
print(f"detention storage about {best[0]:,.0f} m3 ({best[0] / 1233.5:.1f} acre-feet), critical storm duration {best[1]} min")
print(f"as a pond 1.5 m deep: about {best[0] / 1.5 / 10000:.2f} ha of water surface, plus side slopes and access")pre-development peak 1.55 m3/s (55 cfs); post-development peak 9.28 m3/s (328 cfs) detention storage about 9,845 m3 (8.0 acre-feet), critical storm duration 70 min as a pond 1.5 m deep: about 0.66 ha of water surface, plus side slopes and access
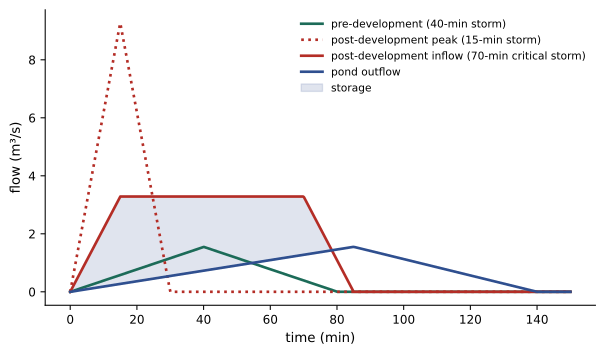
The post-development peak is six times the pre-development peak, and holding it back requires about 10,000 m³ of storage, a pond of about two-thirds of a hectare of water surface, plus side slopes, maintenance access and freeboard. Detailed design uses continuous or design-storm hydrological models and routes flows through the pond's outlet structure for each storm. Stormwater ponds, underground storage, bioretention areas, permeable paving and swales are combined to meet quantity, quality and volume targets; low impact development measures that infiltrate runoff near its source can reduce pond sizes. The space these facilities need is significant and must be included in the yield study (Lesson 4).
Construction disturbing one acre or more requires coverage under the EPA or state Construction General Permit and a stormwater pollution prevention plan (SWPPP), specifying erosion and sediment controls such as silt fences, sediment basins, stabilized construction entrances and phased clearing, with inspections after storms.
Data centers also have specific spill risks: diesel fuel at generators and tanks, transformer oil and glycol from cooling systems. Spill containment, oil-water separators on drainage from fuel and transformer areas, and emergency shut-off valves on pond outlets protect downstream waters (Lesson 9).
Common mistakes
MistakeAssuming municipal water is available because a main runs past the site.
InsteadObtain a capacity assessment covering treatment, mains, storage and fire flow.
MistakeSizing water service on annual average use.
InsteadUse peak day demand plus fire flow.
MistakeIgnoring blowdown in wastewater planning.
InsteadBlowdown can be a quarter or more of make-up water and has high dissolved solids.
MistakeLeaving stormwater ponds out of the site layout.
InsteadDetention and treatment need significant land; include them in yield studies.
MistakeTreating water-free cooling as free.
InsteadDry coolers use more energy on hot days and more space; compare total effects.
Summary and key terms
- Water demand depends on cooling technology; evaporative systems need millions of liters a day at peak, dry coolers almost none.
- Municipal servicing assessments check treatment, mains, storage and fire flow; upgrades are often developer-funded.
- Reclaimed water, wells, surface water and dry cooling reduce demand on drinking water.
- Blowdown and other process water must meet sewer limits and plant capacity.
- Stormwater management controls quantity, quality, volume and water balance; the rational method gives peak flows.
- Detention storage, low impact development, erosion control and spill containment protect downstream waters.
- Make-up water
- Water added to a cooling system to replace evaporation and blowdown.
- Blowdown
- Water drained from a cooling tower to limit dissolved solids.
- Cycles of concentration
- The ratio of dissolved solids in circulating water to those in make-up water.
- Fire flow
- The water flow required for firefighting at a site.
- Reclaimed water
- Treated wastewater supplied for non-potable uses.
- Runoff coefficient
- The fraction of rainfall that becomes runoff in the rational method.
- Time of concentration
- The time for runoff to travel from the farthest point of a catchment to its outlet.
- IDF curve
- Rainfall intensity as a function of duration and return period.
- Detention pond
- A pond that temporarily stores runoff and releases it at a controlled rate.
- Low impact development
- Stormwater measures that infiltrate or retain runoff near its source.
Practice problems
Work each problem on paper first, then reveal the answer to check.
Evaporation 3 million L/day at 5 cycles of concentration: blowdown?
Show answer
0.75 million L/day.
Make-up water for that case?
Show answer
3.75 million L/day.
Why is peak day demand used for servicing?
Show answer
Water systems are sized for maximum day plus fire flow.
Name two alternatives to potable water for cooling.
Show answer
Reclaimed water, groundwater, surface water, or dry cooling.
Rational method (SI): \(C = 0.9\), \(i = 100\) mm/h, \(A = 10\) ha. Peak flow?
Show answer
2.5 m³/s.
Same catchment as farmland with \(C = 0.25\) and \(i = 60\) mm/h?
Show answer
0.42 m³/s.
Why does development raise rainfall intensity in the rational method?
Show answer
Shorter time of concentration means a shorter, more intense design storm.
Volume of a pond 1.5 m deep with 0.8 ha water surface (vertical sides)?
Show answer
12,000 m³.
What are the four objectives of stormwater management?
Show answer
Quantity, quality, volume/erosion and water balance.
Name two data center spill risks.
Show answer
Diesel fuel, transformer oil, glycol.
Lesson quiz · 5 questions
Score 60% or more to complete this lesson.
Create a free account to save your progress, take quizzes and earn a certificate.