
DCE-410 · Lesson 11 of 12 · 29 min
Economic and fiscal impact analysis
Councils, provincial and state governments, and communities weigh a data center's costs against its benefits, and the benefits are usually presented through economic and fiscal impact studies. Developers commission them to support approvals and incentive requests; governments commission their own to test the claims. Done well, these studies give decision-makers a fair picture of jobs, income and tax revenue, set against the infrastructure and services the project will need. Done badly, they inflate benefits with oversized multipliers and ignore costs, which erodes trust when the promised jobs do not appear. This lesson explains how economic impacts are estimated, how to assess the fiscal effect on a municipality over the project's life, how incentives should be evaluated, and how the project may affect electricity rates for other customers.
Kinds of impact
It helps to separate several distinct questions:
- Economic impact: the effect on economic activity, measured as output (spending), value added (GDP), labor income and employment, in a defined region.
- Fiscal impact: the effect on the budgets of governments, comparing tax and fee revenues with the cost of services and infrastructure.
- Distributional effects: who gains and who bears costs, including neighbors, other electricity and water customers, and future taxpayers.
Each must be estimated separately for construction, a temporary but intense period lasting several years for a phased campus, and for operations, which last decades but employ fewer people.
Input-output analysis
Economic impact studies typically use input-output models, which trace how spending in one industry generates purchases from others. The total impact is divided into:
- Direct effects: the project's own spending and employment, such as construction contracts or operating staff.
- Indirect effects: purchases by suppliers from their own suppliers, such as concrete plants buying cement and trucking.
- Induced effects: household spending by the workers employed directly and indirectly, at shops, restaurants and services.
In the US, regional multipliers are available from the Bureau of Economic Analysis (RIMS II) and from commercial models such as IMPLAN.
A multiplier relates total to direct effects; an output multiplier of 1.6, for instance, means each dollar of local direct spending generates 60 cents of additional activity in the region. The key word is local: much data center spending leaves the region immediately. Servers, network equipment, transformers, generators and switchgear are mostly manufactured elsewhere, so only installation, construction labor and local materials stay. Applying a multiplier to the full capital cost, including imported IT equipment, is the most common way that studies exaggerate impacts.
Worked problem
Construction impact
A campus phase costs $1.5 billion, of which $900 million is IT and electrical equipment manufactured outside the region and $600 million is construction work. Of the construction work, 70% is spent with regional contractors, workers and suppliers. Using a regional output multiplier of 1.7 for construction, estimate the regional output impact.
Show solution
- Regional direct spending: \(0.70 \times 600 = \$420\) million.
- Total regional output: \(1.7 \times 420 = \$714\) million.
- A study applying 1.7 to the full $1.5 billion would claim $2.55 billion, more than three times as much.
Answer: About $714 million of regional output over the construction period, a substantial benefit, but far smaller than a headline figure based on the total capital cost. Decision-makers should ask what share of spending is local.
Input-output models have other limitations. They assume fixed relationships between industries and no capacity constraints, so in a tight labor market they overstate net benefits: construction workers on a data center may simply have moved from other local projects (displacement). They report gross rather than net effects unless the analyst compares the project with what would have happened without it. A credible study states its assumptions, the share of local spending, and whether results are gross or net.
Jobs: what to expect
Employment is the benefit most often cited and most often exaggerated. Typical orders of magnitude:
- Construction: a large campus can employ 1,000 to 3,000 workers on site at peak, often for several years, with many traveling from outside the region for specialized trades.
- Operations: a 100 MW building typically needs 30 to 60 full-time staff in operations, security, facilities and IT, with additional contractors for maintenance; a 1 GW campus might employ a few hundred directly.
- Job-years: construction employment is better expressed in job-years (one job for one year) than as "jobs", since a 2,000-worker peak over three years is not 2,000 permanent jobs.
Worked problem
Comparing employment
A campus is built over 6 years with an average of 1,200 construction workers on site, and then employs 250 people directly for 25 years. Compare the construction and operations employment in job-years.
Show solution
- Construction: \(1{,}200 \times 6 = 7{,}200\) job-years.
- Operations: \(250 \times 25 = 6{,}250\) job-years.
Answer: The two are similar in total job-years, but very different in character: construction work is temporary and often filled from outside the region, while operations jobs are permanent, generally well paid and local. Both are real benefits and should be presented accurately rather than combined into one large number.
Permanent jobs per megawatt or per hectare are low compared with manufacturing, which is a frequent point of criticism. On the other hand, data centers pay high wages, demand few public services, and generate large tax revenues per job, which is the core of their fiscal case.
Fiscal impact on the host municipality
For most host municipalities, a data center's main contribution is tax revenue, set against the infrastructure and services it requires.
Revenues include real property taxes on land and buildings, business personal property taxes on equipment in states that levy them (often the largest item, since servers are replaced every few years), impact fees and permit fees, and payments under development agreements or PILOTs (Lesson 10). Costs include roads, water and wastewater upgrades not paid by the developer, fire protection (including any specialized equipment or training), policing, administration and the long-term maintenance of new infrastructure.
Because data centers generate few residents, few schoolchildren and little traffic in operation, their service costs are low relative to their tax base. Fiscal analysis should nonetheless model the full life of the project, including phasing, abatements and the possibility that later phases are not built.
import numpy as np

years = np.arange(1, 21)
# Campus phasing: one building (assessed at $400 million) completed in each of years 2, 4, 6 and 8
assessed = np.array([sum(400e6 for b in (2, 4, 6, 8) if y >= b) for y in years])
rate = 0.012                                           # effective local tax rate on assessed value
abatement = np.where(years <= 10, 0.5, 0.0)           # 50% abatement for the first 10 years of the agreement
revenue = assessed * rate * (1 - abatement)
service_cost = 0.15 * assessed * rate                 # services (roads, fire, administration) as 15% of full tax
upfront = np.where(years == 1, 25e6, 0.0)              # road and water upgrades paid by the municipality in year 1
net = revenue - service_cost - upfront

disc = 1.04 ** -years
print(f"full tax at build-out: ${assessed[-1] * rate / 1e6:.1f} million per year")
print(f"20-year present value at 4%: revenue ${np.sum(revenue * disc) / 1e6:.0f}M, service costs ${np.sum(service_cost * disc) / 1e6:.0f}M, upfront ${np.sum(upfront * disc) / 1e6:.0f}M")
print(f"net fiscal benefit (present value): ${np.sum(net * disc) / 1e6:.0f}M; payback of the upfront cost in year {years[np.argmax(np.cumsum(net) > 0)]}")
foregone = assessed * rate * abatement
print(f"present value of the abatement (tax foregone): ${np.sum(foregone * disc) / 1e6:.0f}M")
# Downside: only two buildings are built
assessed2 = np.array([sum(400e6 for b in (2, 4) if y >= b) for y in years])
net2 = assessed2 * rate * (1 - abatement) - 0.15 * assessed2 * rate - upfront
print(f"if only two buildings are built: net fiscal benefit ${np.sum(net2 * disc) / 1e6:.0f}M, payback in year {years[np.argmax(np.cumsum(net2) > 0)]}")full tax at build-out: $19.2 million per year 20-year present value at 4%: revenue $149M, service costs $29M, upfront $24M net fiscal benefit (present value): $96M; payback of the upfront cost in year 8 present value of the abatement (tax foregone): $44M if only two buildings are built: net fiscal benefit $42M, payback in year 10
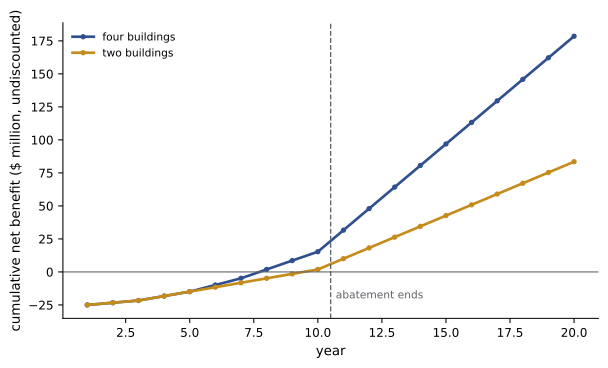
The municipality recovers its upfront infrastructure cost in year 8 and earns a present value of about $96 million over 20 years, even after giving up about $44 million through the abatement. If only half the campus is built, the benefit halves and payback slips, but the municipality is still ahead. Fiscal analysis of this kind tells councils how much they can afford to offer in incentives or infrastructure, and which protections (such as phasing of incentives to construction milestones) limit their downside.
Evaluating incentives
Governments compete for data centers with tax exemptions, abatements and infrastructure funding. Good practice in incentive evaluation asks:
- The "but for" question: would the project have located here without the incentive? If the region has decisive advantages, such as power availability, the incentive may simply transfer money to the developer.
- Cost per job and per dollar of investment, compared with other uses of public funds and with incentives offered for other industries.
- Performance requirements: minimum investment, employment and wage levels, verified annually.
- Clawbacks: repayment of incentives if requirements are not met or the facility closes early.
- Sunset and review: incentives with an end date and periodic independent evaluation of whether they work.
- Transparency: public reporting of the value of incentives and the results achieved.
In the US, more than 30 states offer data center incentives, most commonly sales and use tax exemptions on equipment, often tied to minimum investment and job thresholds. Several state audits and legislative reviews have found that the cost of these exemptions has grown far beyond original estimates as AI-driven investment surged, and some states have narrowed, paused or added conditions to them.
Worked problem
Cost per job
A state sales tax exemption on data center equipment is expected to forgo $60 million of tax per year for a campus that employs 200 people directly. What is the annual cost per direct job, and how should it be interpreted?
Show solution
- Cost per job: \(60{,}000{,}000/200 = \$300{,}000\) per year.
Answer: $300,000 per direct job per year, far above typical incentive costs per job in other industries. The case for the exemption therefore rests not on jobs but on whether the campus would otherwise locate elsewhere, and on the property taxes and other revenues it brings. Analysts should present both sides clearly.
Effects on electricity rates and other customers
Very large loads can affect what other electricity customers pay. If a utility builds generation and transmission to serve data centers and the costs are spread across all customers, households may pay part of the bill; if the data centers leave or never reach their forecast load, the remaining customers may be left with stranded costs. Conversely, large loads with high, steady consumption can spread the fixed costs of the system over more energy and lower average rates, if they pay their full share.
Regulators and utilities have responded with large-load tariffs and contracts that include:
- Contribution in aid of construction or direct assignment of dedicated facility costs.
- Minimum bills or minimum demand charges that require payment for a large share of contracted capacity for 10 to 15 years, whether or not it is used.
- Collateral or credit requirements and exit fees to protect other customers from stranded costs.
- Interruptibility or flexibility provisions that allow faster connection in exchange for curtailment during grid emergencies.
Fiscal and economic studies that ignore electricity cost allocation give an incomplete picture; communities increasingly ask about it directly, and developers who can show they pay their own way have a stronger case.
Presenting the results honestly
An impact study supports a decision; its credibility is its value. Good practice includes: separating construction from operations and temporary from permanent jobs; stating the local share of spending and the multipliers used; distinguishing gross from net effects; including costs as well as benefits; showing downside scenarios such as delayed or canceled phases; and having the study reviewed by an independent party chosen by the government. Projects whose benefits were overstated have contributed to the skepticism now common in established data center markets (Lesson 10).
Common mistakes
MistakeApplying multipliers to total capital cost, including imported equipment.
InsteadUse only the share of spending that stays in the region.
MistakeReporting peak construction workers as "jobs created".
InsteadUse job-years for construction and separate permanent operations jobs.
MistakePresenting revenues without service and infrastructure costs.
InsteadModel net fiscal impact over the project life, with phasing and abatements.
MistakeGranting incentives without performance conditions.
InsteadTie incentives to verified investment and employment, with clawbacks and sunsets.
MistakeIgnoring effects on other electricity customers.
InsteadAddress cost allocation, minimum bills and stranded cost protection.
Summary and key terms
- Economic, fiscal and distributional impacts are distinct and must be estimated separately for construction and operations.
- Input-output models divide impacts into direct, indirect and induced effects; only local spending counts.
- Construction employment is large but temporary; operations employment is small, permanent and well paid.
- Fiscal analysis compares tax and fee revenues with service and infrastructure costs over the full life, including downside cases.
- Incentives should pass the "but for" test and carry performance requirements, clawbacks and sunsets.
- Large-load tariffs protect other electricity customers; honest, reviewed studies build trust.
- Economic impact
- The effect of a project on output, income and jobs in a region.
- Fiscal impact
- The effect of a project on government revenues and costs.
- Input-output model
- A model tracing purchases between industries to estimate total effects of spending.
- Multiplier
- The ratio of total to direct effects.
- Indirect effect
- Activity generated in the supply chain.
- Induced effect
- Activity generated by household spending of workers.
- Displacement
- Activity that would have occurred anyway, counted as new.
- Job-year
- One job held for one year.
- Clawback
- Recovery of incentives when conditions are not met.
- Minimum demand charge
- A charge for a share of contracted capacity regardless of use.
Practice problems
Work each problem on paper first, then reveal the answer to check.
Local direct spending $200 million, multiplier 1.5: total regional output?
Show answer
$300 million.
Why should imported servers be excluded from regional multipliers?
Show answer
Their spending leaves the region immediately.
Name the three components of input-output impacts.
Show answer
Direct, indirect and induced.
800 construction workers for 4 years: job-years?
Show answer
3,200.
Why do data centers typically have favorable fiscal impacts?
Show answer
High tax base and low service demands.
Assessed value $500 million at a 1.1% rate with a 40% abatement: annual tax?
Show answer
$3.3 million.
What is the "but for" test?
Show answer
Whether the project would have happened without the incentive.
Exemption of $24 million per year for 120 jobs: cost per job?
Show answer
$200,000 per year.
What protects other customers from stranded costs if a data center leaves?
Show answer
Minimum bills, collateral and exit fees.
Name two features of an honest impact study.
Show answer
Local share stated, gross vs net, costs included, downside scenarios, independent review.
Lesson quiz · 5 questions
Score 60% or more to complete this lesson.
Create a free account to save your progress, take quizzes and earn a certificate.