
CHEM-211 · Lesson 12 of 12 · 28 min
Capstone: quality assurance, method validation and an analytical report
A number leaving a laboratory is a promise: that it was measured by a method shown to work for this kind of sample, by a competent analyst, with calibrated equipment and traceable standards, and that the laboratory would have noticed if something had gone wrong that day. Quality assurance is the system that keeps that promise. This capstone brings together the whole course. It first describes how laboratories validate methods and control quality from day to day, then follows a complete analysis of a groundwater sample, from sampling to the written report, using the titrations and statistics developed in lessons 1 to 11.
Quality assurance and quality control
Quality assurance (QA) is the overall management system that ensures results are fit for their purpose: documented procedures, training, equipment maintenance and calibration, sample tracking, data review, audits and corrective action. Quality control (QC) is the set of technical activities within it that monitor the analytical process itself: blanks, replicates, spikes, check standards, reference materials and control charts. A useful way to remember the distinction is that QA is about preventing problems and QC is about detecting them.
Laboratories that produce results for regulation, trade or courts are usually accredited to ISO/IEC 17025:2017, General requirements for the competence of testing and calibration laboratories. Its technical requirements include validated methods, estimates of measurement uncertainty, metrological traceability, impartiality and confidentiality, control of data and information systems, and participation in proficiency testing. Accreditation bodies assess laboratories against these requirements and visit them regularly.
In the United States, laboratories testing drinking water for compliance must be certified by their state or by the EPA, and many also hold ISO/IEC 17025 accreditation from bodies such as A2LA or ANAB; the National Environmental Laboratory Accreditation Program (TNI) sets standards widely used by state programs.
Method validation
Before a method is used for real samples, the laboratory must show that it performs as required for its intended use. Validation characterizes the method's figures of merit, many of which you have met already.
| Parameter | How it is evaluated | Lesson |
|---|---|---|
| Selectivity | Analyze blanks, matrix samples and samples with potential interferences added | 1, 9 |
| Linearity and range | Calibration with at least five standards; residual plot; range of acceptable accuracy and precision | 5 |
| Trueness (bias) | Certified reference materials, spike recovery, comparison with a reference method | 3, 4 |
| Precision | Repeatability (same day, analyst, instrument), intermediate precision (different days, analysts), reproducibility (different laboratories) | 3, 4 |
| Limits of detection and quantitation | Replicate blanks or low-level spikes | 5 |
| Robustness | Deliberate small changes (pH ± 0.2, temperature, reagent lot) to see whether results change | 12 |
| Measurement uncertainty | Uncertainty budget or validation data combined | 3 |
Spike recovery is the simplest check on trueness in a real matrix. A known amount of analyte is added to a portion of the sample and both are analyzed; the recovery is the amount found in the spiked portion, minus the amount in the unspiked portion, divided by the amount added. Recoveries of 90 to 110 % are a typical acceptance window for titrimetric methods; trace methods often accept 80 to 120 %. Low recovery suggests loss or a matrix effect; high recovery suggests an interference.
Worked problem
Spike recovery
A groundwater contains 102.9 mg/L Ca by EDTA titration. A 50.00 mL portion is spiked with 1.000 mL of a 2,500 mg/L Ca standard and gives 150.5 mg/L Ca in the final 51.00 mL. Find the recovery.
Show solution
- Expected native Ca in the spiked solution: 102.9 × 50.00/51.00 = 100.9 mg/L.
- Added Ca: 2,500 × 1.000/51.00 = 49.02 mg/L.
- Found from spike: 150.5 − 100.9 = 49.6 mg/L; recovery = 49.6/49.02 = 101.2 %.
Answer: Recovery 101 %, within the 90 to 110 % window.
Robustness testing deserves a word. A method that works only when the buffer pH is exactly 10.00 and the room is exactly 22 °C will fail in routine use. Deliberately varying such factors during validation, often with a small factorial design, reveals which conditions must be tightly controlled and written firmly into the procedure.
Day-to-day quality control
Once a validated method is in use, each batch of samples includes QC samples:
- A method blank, carried through every step, to detect contamination.
- A duplicate of one sample in every ten or twenty, to monitor precision; the relative difference (in %) between duplicates is compared with a limit.
- A matrix spike, to monitor recovery in the actual sample type.
- A check standard or laboratory control sample of known concentration, preferably from a source independent of the calibration standards, to monitor accuracy.
- Periodically, a certified reference material.
Control charts
Walter Shewhart, working at Bell Telephone Laboratories, invented the control chart in 1924 to tell whether a manufacturing process was stable. Analytical laboratories plot the result of each check standard (or recovery, or duplicate difference) in order of analysis on a chart with a center line at the target value and limits based on the method's established standard deviation. The warning limits are at ±2s and the action limits at ±3s. For a stable process, about 1 point in 20 falls outside the warning limits and about 3 in 1,000 outside the action limits, so a point beyond an action limit almost certainly signals a problem.
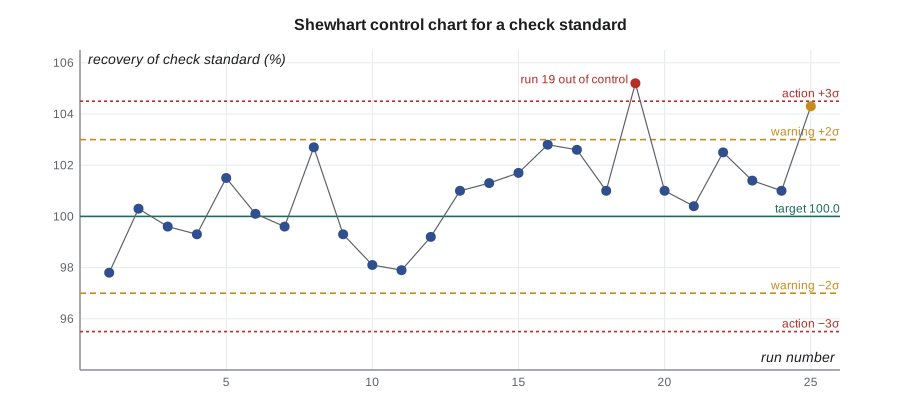
Beyond single points, patterns reveal problems before they become failures. James Westgard's multirule scheme, widely used in clinical and environmental laboratories, flags a run if, for example, one result exceeds 3s (the 1₃s rule), two consecutive results exceed the same 2s limit (2₂s), the range within a run exceeds 4s (R₄s), four consecutive results exceed the same 1s limit (4₁s), or ten consecutive results fall on the same side of the mean (10x). The last two detect slow drift and systematic shifts, such as a deteriorating standard or a gradually fouling electrode, that no single point would reveal.
import random
# the 25 check-standard results plotted in the control chart
rnd = random.Random(12)
x = [round(rnd.gauss(100.0, 1.5), 1) for _ in range(25)]
x[18] = 105.2
for k in (20, 21, 22, 23, 24):
    x[k] = round(x[k] + 1.2, 1)
target, s = 100.0, 1.5
print("runs:", ", ".join(f"{v:.1f}" for v in x))

flags = []
for i, v in enumerate(x):
    run = i + 1
    z = (v - target) / s
    if abs(z) > 3:
        flags.append((run, '1-3s: beyond action limit'))
    elif abs(z) > 2:
        flags.append((run, '1-2s: beyond warning limit (check)'))
    if i >= 1:
        z0 = (x[i - 1] - target) / s
        if (z > 2 and z0 > 2) or (z < -2 and z0 < -2):
            flags.append((run, '2-2s: two in a row beyond the same 2s limit'))
    if i >= 3 and (all((x[j] - target) / s > 1 for j in range(i - 3, i + 1)) or
                   all((x[j] - target) / s < -1 for j in range(i - 3, i + 1))):
        flags.append((run, '4-1s: four in a row beyond the same 1s limit'))
    if i >= 9 and (all(x[j] > target for j in range(i - 9, i + 1)) or
                   all(x[j] < target for j in range(i - 9, i + 1))):
        flags.append((run, '10x: ten in a row on one side of the target'))
for run, msg in flags:
    print(f"run {run:2d}: {msg}")
mean = sum(x[12:]) / len(x[12:])
print(f"mean of runs 13-25 = {mean:.2f} (target {target})")runs: 97.8, 100.3, 99.6, 99.3, 101.5, 100.1, 99.6, 102.7, 99.3, 98.1, 97.9, 99.2, 101.0, 101.3, 101.7, 102.8, 102.6, 101.0, 105.2, 101.0, 100.4, 102.5, 101.4, 101.0, 104.3 run 19: 1-3s: beyond action limit run 22: 10x: ten in a row on one side of the target run 23: 10x: ten in a row on one side of the target run 24: 10x: ten in a row on one side of the target run 25: 1-2s: beyond warning limit (check) run 25: 10x: ten in a row on one side of the target mean of runs 13-25 = 102.02 (target 100.0)
The code finds what the eye might miss. Run 19 is an outright failure that should have stopped the batch, and from about run 13 onward every result sits above the target. Ten consecutive results on one side of the mean is very unlikely by chance (about 1 in 500 for a stable process), so the laboratory should look for a systematic cause, such as a check standard that has partly evaporated or a new lot of EDTA titrant whose concentration was not restandardized. Results reported during the affected runs must be reviewed and, if necessary, the samples reanalyzed.
Proficiency testing
In a proficiency test, a provider sends the same homogeneous sample to many laboratories, each analyzes it as a routine sample, and the provider compares the results. Performance is scored with a z-score, z = (x − X)/σ_p, where X is the assigned value and σ_p the standard deviation for proficiency assessment. |z| ≤ 2 is satisfactory, 2 < |z| < 3 questionable, and |z| ≥ 3 unsatisfactory, requiring investigation and corrective action. Proficiency testing is how accreditation bodies and the laboratories themselves find biases that internal QC, using the laboratory's own standards, cannot see.
Chain of custody
For results that may be used in legal proceedings, such as compliance with an effluent permit or a contamination dispute, a chain-of-custody record documents every person who handled the sample, when, and how it was stored, from the moment of collection to final disposal. A sealed sample with a broken chain of custody may be inadmissible, however good the chemistry.
Capstone: a groundwater analysis
A family on a farm near Mankato, Minnesota, plans to use a new well for drinking water and for watering livestock. Their water treatment dealer has quoted for a softener and asks for an analysis of hardness, alkalinity, chloride and sulfate, together with pH and conductivity. The Minnesota Department of Health recommends regular testing of private wells, and the family brings a sample to an accredited laboratory.
Step 1, define the problem. The questions are practical: how hard is the water (to size a softener), will it scale or corrode plumbing, and are chloride and sulfate high enough to cause taste problems or a laxative effect in people and animals? Aesthetic objectives for drinking water are about 250 mg/L for chloride and about 500 mg/L for sulfate in Canada, and 250 mg/L for both as US secondary standards, so methods need modest detection limits and an accuracy of a few parts in a hundred.
Step 2, choose methods. Classical methods fit perfectly: EDTA titration for total and calcium hardness (lesson 9), acid titration for alkalinity (lesson 8), potentiometric argentometric titration for chloride (lesson 10), gravimetric or turbidimetric sulfate (lesson 10), and pH by a calibrated glass electrode (lesson 11). Sodium and potassium are measured by the laboratory's instrumental section.
Step 3, sample. The well is pumped for several minutes until the water temperature is stable, so the sample represents the aquifer rather than water standing in the casing. Bottles are filled to the top to exclude air, which would let CO₂ escape and change the pH and alkalinity, kept cool and analyzed within a day for alkalinity and pH.
Steps 4 to 6, prepare, measure and calculate. Each determination is done in triplicate with a method blank, a duplicate and a check standard in the batch. The results, with their 95 % confidence intervals from the triplicates, are tabulated below.
| Parameter | Method | Result |
|---|---|---|
| pH | Glass electrode, two-buffer calibration | 7.9 |
| Total hardness | EDTA, pH 10, calmagite | 373 ± 4 mg/L as CaCO₃ |
| Calcium | EDTA, pH 12.5, hydroxynaphthol blue | 102.9 ± 1.2 mg/L |
| Magnesium | By difference | 28.1 ± 1.3 mg/L |
| Total alkalinity | HCl to pH 4.5 | 264 ± 3 mg/L as CaCO₃ |
| Chloride | AgNO₃, potentiometric endpoint | 38.0 ± 0.6 mg/L |
| Sulfate | Gravimetric, BaSO₄ | 140 ± 3 mg/L |
| Nitrate | Instrumental (ion chromatography) | 1.5 mg/L as N |
| Sodium, potassium | Instrumental (ICP) | 45 and 4 mg/L |
Step 7, evaluate. Beyond the routine QC, a powerful independent check on a full water analysis is the ion balance. Because water is electrically neutral, the sum of cations in milliequivalents per liter must equal the sum of anions. A discrepancy of more than a few parts in a hundred means that a result is wrong or a major ion was missed. Alkalinity is converted to bicarbonate at this pH (all of it, since there is no phenolphthalein alkalinity).
# ion balance for the well water (mg/L); meq/L = mg/L / (molar mass / |charge|)
cations = {'Ca2+': (102.9, 40.078, 2), 'Mg2+': (28.1, 24.305, 2), 'Na+': (45.0, 22.990, 1), 'K+': (4.0, 39.098, 1)}
alk_CaCO3 = 264.0                              # total alkalinity as CaCO3, all bicarbonate here
anions = {'HCO3-': (alk_CaCO3 / 50.04 * 61.017, 61.017, 1),
          'Cl-': (38.0, 35.453, 1), 'SO4 2-': (140.0, 96.06, 2), 'NO3-': (1.5 * 62.004 / 14.007, 62.004, 1)}

def meq(d):
    return {k: mg / (M / z) for k, (mg, M, z) in d.items()}

c, a = meq(cations), meq(anions)
for name, val in list(c.items()) + list(a.items()):
    print(f"{name:7s} {val:6.3f} meq/L")
sc, sa = sum(c.values()), sum(a.values())
print(f"sum cations {sc:.3f}, sum anions {sa:.3f}, balance error {(sc - sa) / (sc + sa) * 100:+.2f} %")

hard = (c['Ca2+'] + c['Mg2+']) * 50.04
print(f"hardness from Ca + Mg = {hard:.0f} mg/L as CaCO3; carbonate hardness = {min(hard, alk_CaCO3):.0f}, "
      f"non-carbonate hardness = {max(0, hard - alk_CaCO3):.0f}")
grains = hard / 17.1
print(f"for the softener dealer: {grains:.1f} grains per gallon")

# proficiency-test z-score for this laboratory's hardness result on a PT sample
X, sigma_p, result = 250.0, 7.5, 264.0
print(f"PT z-score = {(result - X) / sigma_p:+.2f}")Ca2+ 5.135 meq/L Mg2+ 2.312 meq/L Na+ 1.957 meq/L K+ 0.102 meq/L HCO3- 5.276 meq/L Cl- 1.072 meq/L SO4 2- 2.915 meq/L NO3- 0.107 meq/L sum cations 9.507, sum anions 9.370, balance error +0.73 % hardness from Ca + Mg = 373 mg/L as CaCO3; carbonate hardness = 264, non-carbonate hardness = 109 for the softener dealer: 21.8 grains per gallon PT z-score = +1.87
The ion balance closes to within 1 %, strong evidence that all the major results are right and no major ion has been missed. The code also splits hardness into carbonate hardness (the part matched by alkalinity, which forms scale when water is heated) and non-carbonate hardness, and converts it to grains per gallon (1 grain per US gallon = 17.1 mg/L as CaCO₃), the unit softener dealers in North America still use.
Step 8, report. A good analytical report is short, complete and honest. It identifies the client and sample (location, date and time of collection, who collected it, condition on arrival), states each result with units and uncertainty, names the method for each parameter, gives detection limits where results are near them, notes any QC failures or deviations from the method and their consequences, compares results with relevant guidelines when the client asks, and is signed by an authorized person. Interpretation should be clearly separated from the measured results.
Worked problem
Writing the conclusion
Draft the interpretation paragraph for the family.
Show solution
- Hardness 373 mg/L as CaCO₃ (21.8 grains per gallon) is very hard; about 264 mg/L of it is carbonate hardness, which will form scale in kettles and water heaters. A softener sized for about 22 grains per gallon is reasonable.
- Chloride (38 mg/L) and sulfate (140 mg/L) are well below aesthetic objectives; nitrate (1.5 mg/L as N) is well below the 10 mg/L health-based limit.
- The pH (7.9) and alkalinity indicate a well-buffered, non-corrosive water. The ion balance closed within 1 %.
- Softening replaces calcium and magnesium with sodium, raising sodium by about 170 mg/L; people on sodium-restricted diets may prefer an unsoftened tap for drinking.
Answer: The interpretation answers the client's actual questions, distinguishes health from aesthetic concerns, and points out a consequence of the recommended treatment.
The sodium figure in the last step deserves a check, because it is easy to get wrong. Hardness of 373 mg/L as CaCO₃ is 3.73 mmol/L of divalent ions; the softener replaces each with two Na⁺, giving 7.45 mmol/L, or 171 mg/L of added sodium. Applying the factor of two a second time, a common slip, would give 343 mg/L. Catching such errors before a report goes out is exactly what independent review is for.
Looking ahead
The classical methods of this course remain the backbone of many laboratories and the reference against which instruments are checked. CHEM-311 Instrumental Analysis extends the same principles of calibration, uncertainty and validation to spectroscopy, chromatography and electroanalytical instruments, and CHEM-331 Environmental Chemistry applies them to air, water and soil. Whatever the method, the habits you have practiced here, careful technique, honest uncertainty and an independent check before reporting, are what make an analytical result trustworthy.
Common mistakes
MistakeQuality control is something done after the results are in.
InsteadQC samples run with every batch; QA builds quality into the whole process.
MistakeA single point outside the warning limit means failure.
InsteadAbout 1 in 20 points falls there by chance; act on action-limit points and on patterns.
MistakeUse the calibration standards as the check standard.
InsteadA check standard from an independent source detects errors in the calibration standards.
MistakeIgnore the ion balance if each titration's QC passed.
InsteadThe ion balance is an independent check that can reveal a missed ion or a wrong result.
MistakeMix measured results and interpretation in the report.
InsteadReport results with uncertainties and methods, then interpret in a separate section.
MistakeCollect well water from a tap that has not run.
InsteadPurge the well until the temperature is stable so the sample represents the aquifer.
Summary and key terms
- QA is the management system for fitness for purpose; QC is the technical monitoring of each batch.
- ISO/IEC 17025:2017 sets requirements for competent laboratories, including validated methods, uncertainty and proficiency testing.
- Validation establishes selectivity, linearity, trueness, precision, detection limits, robustness and uncertainty.
- Spike recovery checks trueness in the real matrix; control charts with Westgard rules detect failures and drift.
- Proficiency tests score performance with z-scores; |z| ≤ 2 is satisfactory.
- For complete water analyses, the ion balance is a powerful independent check.
- A good report gives results with units, uncertainties and methods, and separates interpretation from measurement.
- Quality assurance
- The planned system of activities that ensures results are fit for purpose.
- Quality control
- The technical activities that monitor and verify the analytical process.
- Method validation
- Demonstrating by experiment that a method meets the requirements of its intended use.
- Spike recovery
- The fraction of a known added amount of analyte that the method finds.
- Control chart
- A plot of QC results in time order with warning and action limits.
- Proficiency testing
- Interlaboratory comparison of results on the same sample to assess performance.
- Ion balance
- A comparison of total cation and anion equivalents in a water analysis.
- Chain of custody
- A documented record of everyone who handled a sample.
Practice problems
Work each problem on paper first, then reveal the answer to check.
A sample contains 4.20 mg/L of an analyte. A spike adds 5.00 mg/L and the spiked sample reads 8.85 mg/L. Find the recovery (ignore dilution).
Show answer
(8.85 − 4.20)/5.00 = 93.0 %.
A check standard has target 50.0 and s = 0.8. Give the warning and action limits.
Show answer
The warning limits are 48.4 and 51.6; the action limits are 47.6 and 52.4.
A laboratory reports 18.4 µg/L in a proficiency test with assigned value 15.0 and σ_p = 1.5. Interpret.
Show answer
z = 2.27: questionable; investigate possible bias.
A water has cations 6.45 meq/L and anions 6.02 meq/L. Find the ion balance error.
Show answer
(0.43/12.47) × 100 = 3.4 %; somewhat high, so recheck the major ions.
Convert 180 mg/L hardness as CaCO₃ to grains per gallon.
Show answer
180/17.1 = 10.5 grains per gallon.
Why must alkalinity and pH samples be filled to the top and analyzed promptly?
Show answer
Exchange of CO₂ with air changes both pH and the carbonate system.
Lesson quiz · 5 questions
Score 60% or more to complete this lesson.
Create a free account to save your progress, take quizzes and earn a certificate.