
BUS-450 · Lesson 11 of 12 · 25 min
Performance measurement and strategic control
How does a firm know whether its strategy is working? Financial results arrive late and mix the effects of strategy, execution, luck and the economy. A firm can report rising profits while its competitive position erodes, or report losses while building capabilities that will pay off for years. Strategic control is the set of practices for measuring progress, testing the assumptions behind a strategy, and adjusting course. This lesson covers measures of value creation, the balanced scorecard and strategy maps, objectives and key results (OKRs), the design of key performance indicators, and Robert Simons' levers of control. It builds on the financial tools of FIN-201 and the governance discussion in BUS-310, and connects back to the strategic process of lesson 1.
Measuring value creation
The ultimate test of a strategy is whether it creates value: whether the firm earns returns on invested capital above its cost of capital over time. Return on invested capital (ROIC) is net operating profit after tax (NOPAT) divided by the capital invested in operations. Comparing ROIC with the weighted average cost of capital (WACC, FIN-201 lesson 11) shows whether each dollar invested earns more than investors require. Economic profit, sometimes marketed as economic value added, turns the comparison into a dollar figure: NOPAT minus a charge for the capital used. A business can grow revenue and accounting profit while destroying value, if it earns less than its cost of capital on the capital it absorbs.
# Economic profit for three invented business units ($ millions)
units = {
    "Unit A": {"nopat": 48, "capital": 400},
    "Unit B": {"nopat": 30, "capital": 150},
    "Unit C": {"nopat": 22, "capital": 310},
}
wacc = 0.09
total = 0
for name, u in units.items():
    roic = u["nopat"] / u["capital"]
    ep = u["nopat"] - wacc * u["capital"]
    total += ep
    print(f"{name}: ROIC {roic:5.1%}  economic profit {ep:6.1f}")
print(f"Total economic profit: {total:.1f}")
# Growth only creates value when ROIC exceeds WACC
for roic in (0.07, 0.09, 0.14):
    extra_capital = 100
print(f"Investing 100 more at ROIC {roic:.0%} changes economic profit by {(roic - wacc) * extra_capital:+.1f} a year")Unit A: ROIC 12.0% economic profit 12.0 Unit B: ROIC 20.0% economic profit 16.5 Unit C: ROIC 7.1% economic profit -5.9 Total economic profit: 22.6 Investing 100 more at ROIC 7% changes economic profit by -2.0 a year Investing 100 more at ROIC 9% changes economic profit by +0.0 a year Investing 100 more at ROIC 14% changes economic profit by +5.0 a year
Unit C earns an accounting profit of 22 million dollars but its ROIC of about 7.1 % is below the 9 % cost of capital, so it destroys roughly 5.9 million dollars of value a year. Growing it with more capital at the same returns would destroy more. Unit B is smaller but creates the most value per dollar invested. Measures like these help the corporate parent decide where to invest, restructure or divest (lessons 7 and 8). For listed firms, total shareholder return (dividends plus share price change) measures what investors actually received, though over short periods it reflects changes in expectations as much as performance.
Leading and lagging indicators
Financial measures are lagging indicators: they report the results of past actions. Strategy needs leading indicators as well, measures that predict future financial results, such as customer satisfaction and retention, product quality, employee engagement, innovation pipelines and market share in target segments. A good measurement system links leading indicators to lagging ones through a hypothesis about cause and effect: for example, that faster delivery raises customer retention, which raises revenue per customer, which raises profit. Testing whether the links hold is part of strategic learning.
The balanced scorecard
Kaplan and Norton introduced the balanced scorecard in the early 1990s to complement financial measures with three other perspectives. The financial perspective asks how the firm looks to shareholders. The customer perspective asks how customers see it. The internal process perspective asks what it must excel at. The learning and growth perspective asks how it will sustain its ability to change and improve, through people, systems and culture. Each perspective has objectives, measures, targets and initiatives. Public-sector and non-profit organizations adapt the scorecard by putting their mission at the top, with financial measures as a constraint rather than the goal.
| Perspective | Example objective | Measure | Target | Initiative |
|---|---|---|---|---|
| Financial | Grow profitable revenue | Economic profit | $12 million | Exit low-return product lines |
| Customer | Become the most reliable supplier | On-time delivery rate | 98 % | Customer delivery guarantee |
| Internal process | Shorten order-to-delivery time | Average lead time | 5 days | Redesign scheduling process |
| Learning and growth | Build planning and analytics skills | Staff certified in planning tools | 80 % | Training academy |
Strategy maps
Kaplan and Norton later developed strategy maps, which show the cause-and-effect links among scorecard objectives on a single page. A typical map runs from learning and growth at the bottom (skills, information systems, culture) through internal processes (operations, customer management, innovation, regulatory and social processes) and customer outcomes to financial results at the top. The map makes the strategy's logic explicit, so it can be communicated and tested. If on-time delivery improves but retention does not, the hypothesis linking them is wrong, or something else is limiting retention.
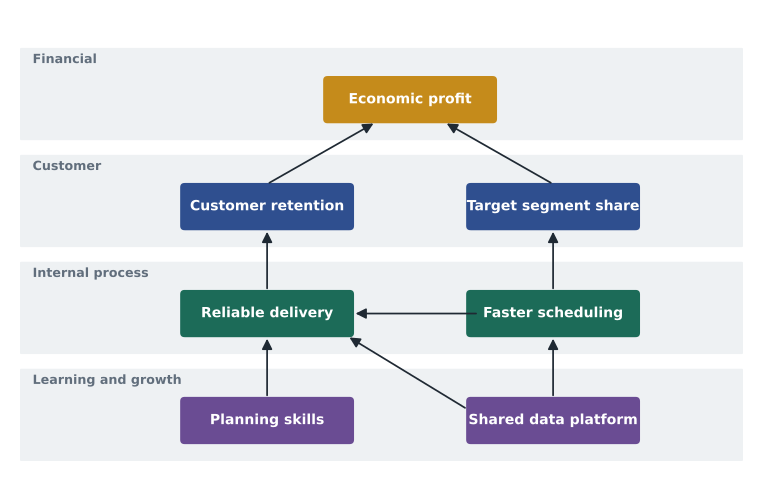
Scorecards have critics. They can become long lists of measures without strategic focus, a problem Kaplan and Norton warned against; they can encourage managers to hit targets in ways that undermine the intent; and the causal links are hypotheses that are rarely tested rigorously. Used well, they force clarity about what the strategy requires and which few measures matter most.
Objectives and key results
Objectives and key results (OKRs), developed at Intel under Andrew Grove and popularized by Google and by John Doerr's writing, are a goal-setting system now widely used in technology firms and beyond. An objective is a qualitative, inspiring statement of what to achieve; key results are a few measurable outcomes that show progress toward it, typically three to five per objective, set for a quarter or a year. OKRs are often ambitious, with achievement of around 70 percent considered good for stretch goals, and are usually separated from compensation so that teams set bold targets honestly. They cascade and align across levels, with teams setting OKRs that support company objectives.
# Grading a quarter's OKRs (each key result scored 0.0 to 1.0)
okrs = {
    "Make onboarding effortless for small merchants": {
        "Cut median setup time from 45 to 20 minutes": (45, 20, 27),      # start, target, actual
        "Raise 30-day activation from 55 % to 70 %": (55, 70, 66),
        "Reduce setup support tickets per 100 sign-ups from 18 to 9": (18, 9, 12),
    },
}
for objective, krs in okrs.items():
    scores = []
    for kr, (start, target, actual) in krs.items():
        score = max(0.0, min(1.0, (actual - start) / (target - start)))
        scores.append(score)
        print(f"  {score:.2f}  {kr}")
print(f"Objective score {sum(scores)/len(scores):.2f}: {objective}")0.72 Cut median setup time from 45 to 20 minutes 0.73 Raise 30-day activation from 55 % to 70 % 0.67 Reduce setup support tickets per 100 sign-ups from 18 to 9 Objective score 0.71: Make onboarding effortless for small merchants
The scoring formula works whether the target is an increase or a decrease, because it measures the share of the distance from start to target that was covered. An average score of about 0.7 on stretch goals, as here, is usually treated as a strong quarter. OKRs and scorecards can coexist: the scorecard tracks the health of the business across perspectives, while OKRs focus teams on a few changes for the period.
Designing good indicators
Key performance indicators (KPIs) should be few, clearly defined, linked to strategy, measurable at reasonable cost, and owned by someone who can influence them. They should balance outcomes with drivers, and short-term with long-term. Goodhart's law warns that when a measure becomes a target, it ceases to be a good measure: people find ways to hit the number without achieving the purpose, such as call centers that close calls quickly by transferring difficult customers, or hospitals that meet wait-time targets by reclassifying patients. Defenses include pairing measures (speed with quality), auditing data, using judgment alongside numbers, and rotating or reviewing measures periodically.
| Weak indicator | Problem | Better alternative |
|---|---|---|
| Number of new products launched | Encourages trivial launches | Revenue share from products launched in the last three years |
| Calls handled per hour | Encourages rushing or transferring customers | First-contact resolution rate paired with satisfaction |
| Training hours completed | Measures activity, not capability | Share of staff certified and applying skills on the job |
| Revenue growth | Ignores capital and profitability | Economic profit growth or ROIC above WACC |
| Website visits | Vanity metric with weak link to value | Conversion rate and customer lifetime value |
Strategic control
Schreyögg and Steinmann distinguished several forms of strategic control. Premise control checks whether the assumptions underlying the strategy (about markets, technology, competitors or regulation) still hold. Implementation control checks whether strategic initiatives are progressing and producing expected intermediate results. Strategic surveillance scans broadly for unexpected developments. Special alert control responds to sudden events, such as a major disruption or crisis, with rapid reassessment. Together they move strategic management away from a once-a-year plan toward continuous learning.
Robert Simons described four levers of control that leaders use together. Belief systems (mission, values, purpose) inspire and guide the search for opportunities. Boundary systems (codes of conduct, rules, strategic boundaries) define what is off limits. Diagnostic control systems (budgets, scorecards, KPIs) monitor outcomes and correct deviations, mostly by exception. Interactive control systems are the few measures senior leaders discuss personally and regularly with managers, focusing attention on strategic uncertainties and encouraging debate and learning. The balance between empowering people to innovate and keeping them within limits is central to control in any organization.
Reporting performance to investors in the United States
US public companies report under US GAAP and must include management's discussion and analysis (MD&A) in annual and quarterly filings with the SEC, explaining results, risks and known trends. Regulation G and related SEC rules require firms that present non-GAAP measures, such as adjusted earnings, to reconcile them with GAAP figures and not give them undue prominence. Since 2020, firms must also describe their human capital resources, including measures management uses, to the extent material. Strategy discussions in annual reports and investor days often present scorecards of strategic and financial targets.
Worked problem
Building a strategy map and scorecard
An invented regional credit union's strategy is to win young families by offering the easiest digital mortgage and savings experience in its region, while keeping its community branch network for advice. Draft one objective and one measure for each perspective and the causal links between them.
Show solution
- Learning and growth: build digital product and advice skills; measure the share of staff certified in digital mortgage advice (target 75 %).
- Internal process: approve mortgages quickly and accurately; measure median time from application to approval (target under 3 days) paired with error rate.
- Customer: become the first choice for young families; measure net growth in members aged 25 to 40 and their product holdings per member.
- Financial (mission-adjusted for a co-operative): sustainable growth with strong capital; measure economic profit and the regulatory capital ratio.
- Causal logic: trained staff and better systems speed approvals, faster approvals attract and retain young families, more products per member raise economic profit and capital.
Answer: The map makes the strategy testable: if approval times fall but young-family growth does not rise, the credit union must revisit its assumptions about what drives choice.
Common mistakes
MistakeAccounting profit shows whether a strategy creates value.
InsteadValue is created only when returns exceed the cost of capital; economic profit captures this.
MistakeA scorecard should include every measure the firm tracks.
InsteadA scorecard should focus on the few measures that reflect the strategy's cause-and-effect logic.
MistakeOKRs should be tied directly to bonuses.
InsteadTying stretch OKRs to pay encourages sandbagging; most practitioners separate them.
MistakeOnce a target is set, hitting it proves success.
InsteadGoodhart's law: targets can be met in ways that defeat their purpose; pair and audit measures.
MistakeStrategic control means comparing results with the annual plan once a year.
InsteadStrategic control continuously checks premises, implementation and the environment.
Summary and key terms
- Strategies create value when ROIC exceeds WACC; economic profit measures the value in dollars.
- Lagging financial measures need leading indicators linked by explicit cause-and-effect hypotheses.
- The balanced scorecard adds customer, internal process and learning-and-growth perspectives to finance.
- Strategy maps show the causal logic of a strategy on a page and make it testable.
- OKRs focus teams on ambitious, measurable outcomes for a period and are usually separated from pay.
- Good KPIs are few, clear, owned and balanced; Goodhart's law warns against gaming.
- Strategic control includes premise control, implementation control, surveillance and special alerts; Simons' four levers balance freedom and limits.
- Return on invested capital
- Net operating profit after tax divided by invested operating capital.
- Economic profit
- NOPAT minus a capital charge equal to WACC times invested capital.
- Leading indicator
- A measure that predicts future results.
- Lagging indicator
- A measure that reports past results.
- Balanced scorecard
- A measurement system with financial, customer, internal process and learning-and-growth perspectives.
- Strategy map
- A diagram of cause-and-effect links among strategic objectives.
- Objectives and key results
- A goal-setting system pairing qualitative objectives with measurable key results.
- Goodhart's law
- When a measure becomes a target, it ceases to be a good measure.
- Premise control
- Checking whether the assumptions behind a strategy still hold.
- Interactive control system
- Measures senior leaders use personally to focus attention on strategic uncertainties.
Practice problems
Work each problem on paper first, then reveal the answer to check.
NOPAT $30 million, invested capital $250 million, WACC 10 %. Economic profit?
Show answer
30 − 25 = $5 million.
What is the ROIC in that case?
Show answer
12 %.
Give a leading indicator for a subscription business.
Show answer
Customer retention or engagement rate.
Name the four balanced scorecard perspectives.
Show answer
Financial, customer, internal process, learning and growth.
What does a strategy map add to a scorecard?
Show answer
It shows the cause-and-effect links among objectives.
A key result runs from 40 to 60 and the actual is 52. Score?
Show answer
(52 − 40) ÷ 20 = 0.6.
State Goodhart's law.
Show answer
When a measure becomes a target, it ceases to be a good measure.
What is premise control?
Show answer
Checking whether the strategy's underlying assumptions remain valid.
Name Simons' four levers of control.
Show answer
Belief systems, boundary systems, diagnostic controls and interactive controls.
Portfolio task: design a one-page strategy map and five KPIs for an organization you know, identifying one hypothesis you would test first.
Show answer
Answers vary; ensure measures are few, linked and balanced.
Lesson quiz · 5 questions
Score 60% or more to complete this lesson.
Create a free account to save your progress, take quizzes and earn a certificate.