
BAS-220 · Lesson 8 of 12 · 27 min
Trends and data collection
▶ Video coming soon A video version of this lesson is on the way.
Gus Thibodeaux wanted numbers. Harcastle College had committed to a campus energy plan, and he needed a year of data on Tilden Hall's air handlers: run hours, supply and return temperatures, valve and damper positions, and the outdoor conditions that explained them. On Saturday, October 17, Sophie used the workshop to set up the trend logs for AHU-1 and AHU-2, with Callie at the keyboard. "A trend is the building's memory," Sophie said. "When something goes wrong at three in the morning, the trend is the only witness. Set it up badly and the witness saw nothing." Twelve days later, as BAS-130 described, those AHU-2 trends showed the discharge air loop hunting. This lesson covers trends: what they record, how often, where the data goes and how to set them up so that they answer the questions people will ask.
What a trend log is
A trend log records the value of a point over time: a list of samples, each with a timestamp and a value, and often a status flag saying whether the value was valid. The controller collects samples into a buffer in its own memory, and a supervisory controller or server periodically reads the buffer and stores the samples in a long-term history database, from which graphs and reports are drawn. In BACnet, the Trend Log object does this job, with properties for the point being logged, the logging method, the interval, the buffer size and the records themselves.
Trends serve two purposes, and they need different settings. Troubleshooting and tuning trends are short and fast: a few hours or days at a sample every few seconds, on the handful of points in one loop. Long-term trends are slow and many: months or years at a sample every few minutes or every change, on most of the important points in the building. The same point may have both. The AHU-2 discharge air temperature that BAS-130's Callie retuned had a five-minute long-term trend for Gus and, from October 17, a fast trend for Sophie as well.
| Purpose | Typical interval | Typical length | Points |
|---|---|---|---|
| Loop tuning and troubleshooting | A few seconds | Hours to days | PV, SP and output of one loop, plus related inputs |
| Commissioning and checkout | 10 seconds to 1 minute | Days to weeks | Every point in the system being commissioned |
| Energy and performance reporting | 5 to 15 minutes, or change of value | Years | Temperatures, flows, run status, meters |
| Alarm and event history | Each event | Years | Alarm states, acknowledgments, overrides |
Interval and change-of-value logging
There are two main ways to decide when to take a sample. Interval logging takes one at fixed times, such as every five minutes. It is simple, predictable in storage and easy to graph, but it can miss what happens between samples. Change-of-value logging, often called COV logging, takes a sample whenever the value changes by more than a set increment, and sometimes also at a long fixed interval as a heartbeat. COV logging captures every significant change in a fast event and records almost nothing while the value is steady, but its storage use is unpredictable and its increment must be chosen with care.
Binary points such as fan status are usually logged on change: each time the fan starts or stops, a sample is recorded with the exact time. That gives accurate run hours and start counts. Analog points can be logged either way. Sophie used intervals for Gus's energy trends, because his analysis tools expected regular data, and COV for the fast troubleshooting trends on loops, with an increment small enough to see the loop working.
Sampling fast enough
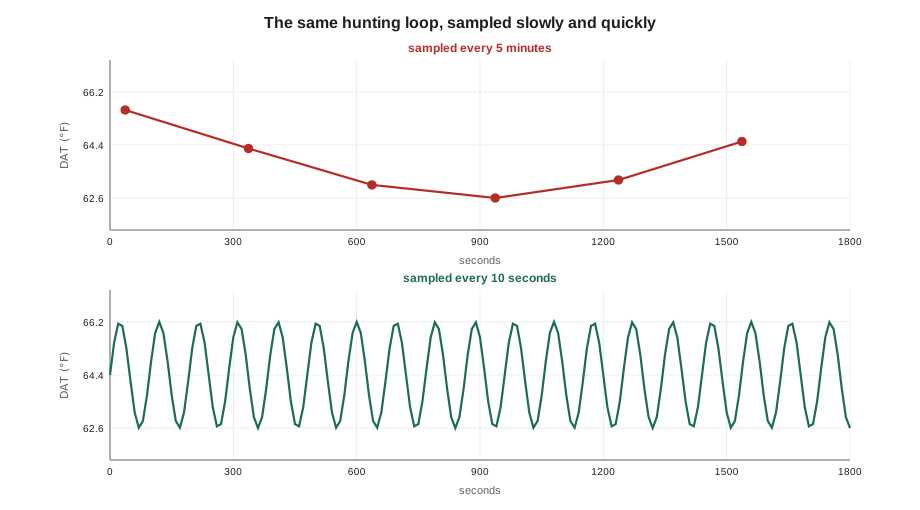
A trend cannot show anything that happens faster than its samples. A loop that hunts with a period of a minute and a half, sampled every five minutes, produces a trend that looks steady or wanders at random, because each sample catches the wave at a different point. To see a cycle, the samples must be much closer together than the cycle's period. A common working rule is at least five samples per cycle, and ten is better.
Worked problem
Choosing a sample interval for a hunting loop
AHU-2's discharge air loop was found hunting with a period of about 96 seconds. Its long-term trend sampled every 300 seconds. How many samples per cycle did the long-term trend take? What interval gives at least five samples per cycle, and what did Sophie choose?
Show solution
- Samples per cycle at 300 s: 96 ÷ 300 = 0.32, less than one sample per cycle.
- For five samples per cycle: 96 ÷ 5 = 19.2 s or shorter.
- Sophie chose 10 s, giving 96 ÷ 10 = 9.6 samples per cycle.
Answer: The five-minute trend caught less than one sample per cycle and could never show the hunting. A 10 second interval shows it clearly. BAS-130 described what Callie found when she looked.
The same rule applies to events. A fan that trips and restarts within a minute does not appear on a five-minute interval trend of its status at all. That is one reason binary points are logged on change.
Choosing a COV increment
For COV logging, the increment decides how much detail is kept. Too small, and noise fills the buffer: a temperature sensor that flickers by 0.1 °F logs a sample every few seconds even when nothing is happening. Too large, and real changes are lost. A good increment is a little larger than the sensor's normal noise and smaller than the smallest change anyone cares about. For space and air temperatures, values around 0.2 to 0.5 °F are typical for troubleshooting and somewhat larger for long-term logs.
Worked problem
How many samples a COV trend records
A space temperature rises steadily from 64.4 °F to 69.8 °F over 90 minutes during warm-up. With a COV increment of 0.4 °F, about how many samples are recorded during the rise? How many would a 10 second interval trend record?
Show solution
- COV: 5.4 °F ÷ 0.4 °F = 13.5, about 14 samples.
- Interval: 90 × 60 ÷ 10 = 540 samples.
Answer: About 14 COV samples against 540 interval samples, for the same picture of a smooth rise. COV is efficient for slowly changing values; intervals are better when the value moves quickly or a regular time base is needed.
Buffers, uploads and storage
A controller's trend buffer holds a limited number of samples per log, often a few hundred to a few thousand. When the buffer is full, it either stops logging or, more usually, overwrites the oldest samples. If the supervisory controller does not read the buffer before it wraps around, data is lost. So the buffer size, the sample interval and the upload frequency must fit together.
Worked problem
Sizing trend storage
Gus's energy trends log 40 points on AHU-1 and AHU-2 every 5 minutes. Each controller log holds 1,000 samples. How many samples per point per day are recorded? How long before a buffer wraps? If each stored sample takes about 12 bytes in the history database, how much storage does a year take?
Show solution
- Samples per hour: 60 ÷ 5 = 12.
- Per point per day: 12 × 24 = 288.
- All 40 points per day: 288 × 40 = 11,520.
- Buffer time: 1,000 ÷ 288 = 3.47 days.
- Storage per day: 11,520 × 12 = 138,240 bytes.
- Per year: 138,240 × 365 = about 50.5 million bytes, about 50 MB.
Answer: Each buffer wraps after about three and a half days, so the server must collect at least every three days; Sophie set it to collect every six hours. A year of these trends needs only about 50 MB, so storage was not the limit; the controllers' buffers were.
If the supervisory controller or the network is down for longer than the buffer time, the gap is permanent. Long-term trends should therefore be collected often, with an alarm if collection fails. The history database also needs backing up, which BAS-320 and BAS-420 return to. Sophie added a check to Quillon's service visits: open a long-term trend and look for gaps, which reveal collection faults that nobody noticed.
Timestamps and time
A trend is only as good as its timestamps. If one controller's clock is two minutes fast, its fan status trend shows the fan starting two minutes before the supply air temperature begins to drop in a trend from another controller, and the analysis is wrong. Lesson 7's clock synchronization matters here too. Daylight saving time adds another trap: in the autumn, one hour of local time happens twice, and in the spring one hour is skipped. Many history databases store timestamps in coordinated universal time and convert for display, which avoids both problems. A technician comparing trends across time changes should know which the system does.
What to trend together
A single trend rarely answers a question by itself. To understand a loop, the process variable, the setpoint and the output must be on the same graph, at the same interval, ideally from the same controller. To understand an air handler, the fan status, the supply and mixed air temperatures, the outdoor air temperature, and the damper and valve positions belong together. Sophie set up trend groups, named sets of points that are displayed together, for each air handler: a loop group for each loop and a summary group for the unit.
| Trend group | Points |
|---|---|
| AHU-2 discharge air loop | Discharge air temperature, its setpoint, heating valve output, loop enable |
| AHU-2 economizer | Mixed air, return air and outdoor air temperatures, damper output, economizer enable |
| AHU-2 summary | Fan command and status, occupancy, discharge air temperature, static pressure, alarms |
| AHU-2 energy | Fan run status, heating valve and damper positions, outdoor temperature, supply and return temperatures |
Callie asked why the loop enable was in the loop group. Sophie's answer came from experience: without it, a trend that shows the output stuck at zero looks like a broken loop; with it, the reader can see the loop was simply disabled. Trends of commands and statuses together, such as fan command and fan status, show failures as a gap between the two lines, which is exactly what the XOR mismatch logic of lesson 4 detects.
Reading a trend
Good trend reading is a habit of asking what each line should be doing. A setpoint should be flat or changing as the sequence says. A process variable should be near its setpoint, with small, quickly damped departures after disturbances. An output should move smoothly and stay inside its limits most of the time; an output pinned at 0 or 100 for hours means the loop cannot do its job, because the plant is too small, the device is broken or the sequence is asking for the impossible. A regular wave in any loop line means hunting. A flat line that should not be flat, such as a temperature that never changes by even a tenth of a degree, often means a sensor that has failed, a point that is out of service, or a trend that has stopped collecting.
Trends for meters and totals
Energy meters need their own approach. A meter usually provides either a pulse for each unit of energy or a running total. Trending the instantaneous demand every few minutes shows the load profile, while trending the total once an hour or once a day gives consumption that adds up correctly even if some samples are missed, because the difference between two totals is always the energy used between them. Sophie set up Tilden's steam meter trends both ways for Gus: demand every 5 minutes, total every hour. If the total is not retained in the controller, as lesson 1 warned, a restart breaks the series, so she kept the running total in the supervisory controller instead.
Worked problem
Consumption from totals
Tilden's steam meter total reads 48,215 at 8:00 and 48,397 at 12:00, in the meter's units. How much was used over the four hours, and what was the average use per hour? One 10:00 sample is missing from the trend; does that change the answer?
Show solution
- Use: 48,397 − 48,215 = 182 units.
- Average per hour: 182 ÷ 4 = 45.5 units.
- The missing sample does not matter, because consumption comes from the difference between totals.
Answer: 182 units in four hours, about 45.5 an hour. Totals give correct consumption even with gaps; demand trends do not.
Common mistakes
MistakeUsing a slow interval to look for a fast problem.
InsteadSample at least five, and preferably ten, times per cycle of the behavior you want to see.
MistakeSetting a COV increment smaller than the sensor's noise.
InsteadChoose an increment a little above normal noise and below the smallest change that matters.
MistakeLetting controller buffers wrap before they are collected.
InsteadCollect long-term trends well within the buffer time and alarm if collection fails.
MistakeTrending a loop's process variable without its setpoint and output.
InsteadTrend PV, SP, output and enable together at the same interval.
MistakeIgnoring clock errors and time changes.
InsteadSynchronize clocks and know whether the history stores local time or universal time.
Summary and key terms
- A trend log records timestamped samples of a point, buffered in the controller and collected into a history database.
- Troubleshooting trends are short and fast; long-term trends are long and slow.
- Interval logging is regular and predictable; COV logging records changes efficiently but unpredictably.
- To see a cycle, sample at least five times per period; slow intervals can hide hunting completely.
- Buffer size, sample interval and collection frequency must fit together, or data is lost.
- Accurate, synchronized timestamps are essential for comparing trends.
- Trend groups put related points together so that trends can answer real questions.
- Trend log
- A record of a point's value over time, as timestamped samples.
- Interval logging
- Recording a sample at fixed time intervals.
- COV logging
- Recording a sample whenever a value changes by more than a set increment.
- COV increment
- The change in value that triggers a new COV sample.
- Trend buffer
- The controller memory that holds trend samples until they are collected.
- History database
- The long-term store of trend samples on a server or supervisory controller.
- Trend group
- A named set of points displayed together on one graph.
- Heartbeat sample
- A regular sample recorded by a COV log even when the value has not changed.
Practice problems
Work each problem on paper first, then reveal the answer to check.
A loop hunts with a period of 60 seconds. What is the longest interval that gives five samples per cycle?
Show answer
60 ÷ 5 = 12 seconds.
20 points are logged every 15 minutes. How many samples per point per day?
Show answer
4 × 24 = 96.
A 500-sample buffer logs every 5 minutes. How long until it wraps?
Show answer
500 ÷ 288 = about 1.7 days.
Why log fan status on change rather than every five minutes?
Show answer
To capture every start and stop with its exact time, including brief trips.
A temperature trend has been perfectly flat for two days. What might that mean?
Show answer
A failed sensor, a point out of service or a trend that has stopped collecting.
Lesson quiz · 5 questions
Score 60% or more to complete this lesson.
Create a free account to save your progress, take quizzes and earn a certificate.