
AWS-104 · Lesson 4 of 12 · 19 min
The AWS Pricing Calculator
▶ Video coming soon A video version of this lesson is on the way.
Lorraine's next question arrives on November 6: "What will production cost each month, roughly, before we sign anything?" The board approved the move in September on the basis of a rough comparison. Now she wants a line-by-line estimate she can put in the 2027 budget. Gwen and Mateo spend the session building it in the AWS Pricing Calculator.
An estimate made before a system exists will never be exact. Its value is in making every assumption visible: how many servers, of what size, running how many hours, storing how much data, sending how much out. When the real bill arrives, the team can compare it with the estimate line by line and see which assumption was wrong. This lesson explains what the calculator does, how to build a useful estimate, and how it fits with the other ways to find AWS prices.
What the Pricing Calculator is
The AWS Pricing Calculator is a free web tool for estimating the cost of AWS services before you use them. You do not need an AWS account to use the public version. You choose services, enter the configuration and expected usage, and the calculator shows monthly and up-front costs, plus a twelve-month total. Estimates can be organized into groups, saved, exported (for example as a spreadsheet file or PDF) and shared with a link.
There is also a version inside the AWS Billing and Cost Management console. It can take your account's actual usage history as a starting point and apply the discounts and commitments that apply to your account, which makes it useful once workloads are running and you want to model changes such as adding a Savings Plan or moving a workload. The public version uses public list prices.
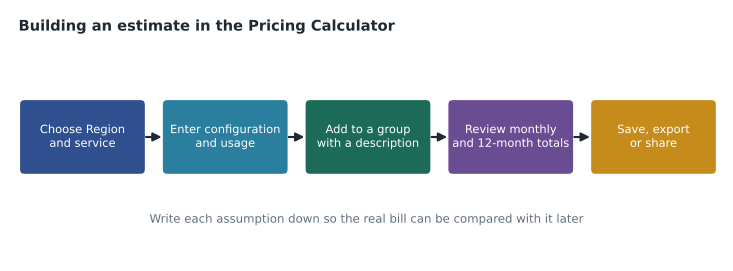
Building an estimate
Gwen's method is to start from the architecture, not from the calculator. She lists each component of the planned production design and the assumption behind each number, then enters them.
| Group | Service | Main assumptions (illustrative) |
|---|---|---|
| Practice system | Amazon RDS for SQL Server | One Multi-AZ database instance, license included, 500 GB of storage, automated backups kept 14 days |
| Practice system | Amazon EC2 | Two application servers running all the time, Windows, in two Availability Zones |
| Practice system | Elastic Load Balancing | One Application Load Balancer |
| Imaging | Amazon S3 | 38 TB, growing 0.5 TB a month, with a lifecycle rule; requests from 12 sites |
| Imaging | Data transfer | Images viewed by referring vets and owners: about 800 GB out a month |
| BookVet | Amazon EC2 | Two small Linux instances behind the load balancer |
| Backup and recovery | AWS Backup and S3 in the recovery Region | Daily backups kept 35 days; a copy of the archive in the second Region |
| Shared | Amazon CloudWatch, AWS CloudTrail, VPC endpoints, NAT gateway | Logs and metrics, one trail, one NAT gateway per Availability Zone |
Each service in the calculator asks for the details that drive its price. For EC2, that means the Region, operating system, instance type or required vCPUs and memory, how many instances, how many hours they run, the pricing model (On-Demand, Savings Plans, Reserved or Spot) and the attached EBS storage. For S3, it means the storage class, gigabytes stored, number of requests, and data retrieved or transferred.
Mateo enters the practice system group first. The calculator lets him compare pricing models side by side, so he can see the same EC2 servers at On-Demand rates and with a three-year Savings Plan. He records the On-Demand figure in the main estimate, because the team will not commit until production has run for a few months, and adds a note with the potential commitment saving.
Regions, currencies and taxes
The calculator asks for a Region for each service, because prices differ by Region. Mateo builds the main estimate in US West (Oregon) and the recovery copy in US East (Ohio). He then copies one group into another Region to see how much the choice of Region changes the total, which is useful for the board even though data residency has already decided the answer.
Estimates are shown in US dollars. Taxes are not included. Depending on the state and the services, sales tax may be added to the invoice. Lorraine asks for a separate line for tax so the budget matches the real invoice.
Reading the result
The calculator shows each service's monthly cost, any up-front cost, and the total for twelve months. Gwen's estimate, rounded and illustrative, looks like this:
# Illustrative monthly estimate in USD, On-Demand rates, before commitments.
estimate = {
    "Practice system (RDS, EC2, load balancer)": 6150,
    "Imaging (S3 storage, requests, transfer out)": 1620,
    "BookVet (EC2)": 140,
    "Backup and recovery Region": 1110,
    "Shared (logs, monitoring, NAT, endpoints)": 780,
}
monthly = sum(estimate.values())
for k, v in estimate.items():
    print(f"{k:45} {v:7,d}")
print(f"{'Monthly total':45} {monthly:7,d}")
print(f"{'Twelve months':45} {monthly * 12:7,d}")Practice system (RDS, EC2, load balancer) 6,150 Imaging (S3 storage, requests, transfer out) 1,620 BookVet (EC2) 140 Backup and recovery Region 1,110 Shared (logs, monitoring, NAT, endpoints) 780 Monthly total 9,800 Twelve months 117,600
What this code does
It lists the illustrative monthly cost of each part of the planned setup, adds them into a monthly total, and multiplies by twelve for a yearly figure. The output is the line-by-line estimate a team would put in front of a finance manager.
About 9,800 US dollars a month before any commitment. Lorraine compares it with her spreadsheet of on-premises costs, which, once the replacement storage array, licenses, maintenance, power and Mateo's time are included, is in the same range. The comparison is not the whole case for the move, since availability and the overheating server room also matter, but it shows the board's decision was not a financial gamble.
Assumptions are the estimate
Gwen insists that every service entry carries a description of its assumptions. The calculator has a description field for each service and group. Six months from now, when someone asks why the estimate said 800 GB a month of transfer out, the answer should be on the estimate, not in someone's memory.
- Write the units and the source. "800 GB out a month, from the current portal's traffic report for September 2026."
- Separate one-time from monthly costs. The first copy of the archive to the recovery Region is a one-time transfer, not a monthly cost.
- Round sensibly. An estimate to the cent suggests a precision it does not have.
- Show the range. Add a second version with the high assumptions, for example twice the transfer out, so the budget has a cushion.
Other ways to find prices
The Pricing Calculator is not the only source of price information. The exam guide expects you to know where pricing information lives.
| Source | What it gives | When to use it |
|---|---|---|
| Service pricing pages on aws.amazon.com | Each service's current rates and pricing dimensions, by Region | Understanding how a service is priced |
| AWS Pricing Calculator (public) | Estimates of planned workloads at list prices | Planning and budgeting before you build |
| Pricing Calculator in the Billing and Cost Management console | Estimates that can include your account's usage and discounts | Modeling changes to running workloads |
| AWS Price List API | Machine-readable price lists for programs | Building your own tools or reports |
| Cost Explorer and the bill | What you actually spent | Comparing reality with the estimate (lessons 5 and 6) |
# Example: list EC2 attributes from the AWS Price List API (read-only).
aws pricing get-attribute-values --service-code AmazonEC2 \
    --attribute-name instanceType --region us-east-1 --max-results 5
Estimates versus bills
An estimate is a forecast; the bill is a fact. Three things usually separate them. Usage differs from the assumptions, for example more images viewed or a server running longer. Configuration changes after the estimate, for example a bigger database after a performance test. Prices change, usually downward, and new instance types arrive. Gwen plans a monthly review in the first year of production: Mateo will export the actual costs by service from Cost Explorer and compare them with the estimate groups.
Ranges and sensitivity
A single number hides uncertainty. Gwen asks Mateo to build two more versions of the estimate: a low case with the smallest sensible servers and transfer, and a high case with larger servers, twice the transfer out and faster growth of the imaging archive. Presenting the three together tells Lorraine both the likely cost and how wrong it could be.
# Illustrative low, expected and high monthly estimates in USD.
cases = {
    "low":      {"compute": 5200, "storage": 1250, "transfer": 60,  "other": 1700},
    "expected": {"compute": 6290, "storage": 1500, "transfer": 120, "other": 1890},
    "high":     {"compute": 7800, "storage": 1800, "transfer": 260, "other": 2100},
}
for name, parts in cases.items():
    print(f"{name:9} {sum(parts.values()):7,d} USD a month")
spread = sum(cases["high"].values()) - sum(cases["low"].values())
print(f"spread between low and high: {spread:,d} USD a month")low 8,210 USD a month expected 9,800 USD a month high 11,960 USD a month spread between low and high: 3,750 USD a month
What this code does
It adds up three versions of the monthly estimate, a low, an expected and a high case, each split into compute, storage, data transfer and other costs. It prints each total and the gap between the low and high cases, showing how uncertain the estimate is.
The spread shows where the uncertainty lies. Most of it is compute, which the December load test will pin down. Transfer is small in every case. That tells the team where to spend effort before the next version of the estimate: measure the servers, not the downloads.
Estimating running workloads
After production starts, the estimate changes job. Instead of predicting an unknown system, it models changes to a known one. The Pricing Calculator inside the Billing and Cost Management console can start from the account's real usage and apply the rates the account actually pays, including existing commitments. Mateo will use it in 2027 to answer questions such as "what if we add a Savings Plan?" or "what if the imaging archive moves to a colder class sooner?" without building an estimate from scratch.
Common estimating mistakes
- Forgetting the second Availability Zone or Region. A resilient design often runs two copies; estimates sometimes price only one.
- Pricing storage at its starting size. Data grows; the imaging archive adds about half a terabyte a month.
- Leaving out shared services. NAT gateways, load balancers, logs, monitoring, backups and support plans are easy to miss.
- Mixing up hours. A month has about 730 hours, not 720 or 744, in most calculators.
- Ignoring licenses. License-included Windows and SQL Server rates are much higher than Linux rates for the same instance size.
Mateo checks the production estimate against this list and finds he had priced the backup copy in the recovery Region but not the transfer to get it there. He adds the one-time transfer from lesson 3 as a separate line.
Sharing the estimate
Gwen saves the estimate and shares its link with Lorraine and the board's finance committee, and exports a spreadsheet copy for the budget file. A shared estimate link opens a read-only copy of the estimate at the moment it was shared; later edits create a new version and a new link. Mateo labels each version with a date and a short reason, such as "after load test" or "with recovery transfer added", so nobody compares a November figure with a February one by mistake.
Worked problem
Updating an assumption
The estimate assumed 800 GB a month of images sent out to the internet at an illustrative 0.09 USD per GB after the free allowance of 100 GB. A pilot shows the real figure is closer to 1,500 GB. How much does the monthly transfer line change?
Show solution
- Old billable amount: 800 − 100 = 700 GB; 700 × 0.09 = 63 USD.
- New billable amount: 1,500 − 100 = 1,400 GB; 1,400 × 0.09 = 126 USD.
- Difference: 126 − 63 = 63 USD a month.
Answer: About 63 USD more each month, illustrative, which is why the transfer assumption is worth checking early.
Common mistakes
MistakeThe Pricing Calculator shows exactly what the bill will be.
InsteadIt shows an estimate from your assumptions; usage, configuration and prices can all differ.
MistakeYou need an AWS account to use the Pricing Calculator.
InsteadThe public calculator works without an account; the console version uses your account's data.
MistakeEstimates include taxes.
InsteadEstimates are shown before taxes; taxes and currency are handled on the invoice.
MistakeOne Region's prices apply everywhere.
InsteadPrices are set per Region, so each service in an estimate is priced in its chosen Region.
Summary and key terms
- The AWS Pricing Calculator is a free tool for estimating AWS costs before building.
- Estimates are built service by service in a chosen Region, organized into groups, and can be saved, exported and shared.
- The public version uses list prices; the version in the Billing and Cost Management console can use your account's usage and discounts.
- Good estimates start from the architecture, write down every assumption, separate one-time from monthly costs and show a range.
- Prices also come from service pricing pages and the Price List API.
- Estimates differ from bills because usage, configuration and prices change, so they should be compared regularly with actual costs.
- AWS Pricing Calculator
- A free web tool for estimating the cost of AWS services
- Estimate group
- A named set of services within an estimate, such as one application
- List price
- The public price for a service before any discounts
- AWS Price List API
- A programmatic way to query current AWS prices
- One-time cost
- A cost incurred once, such as an initial data copy, rather than each month
- Assumption
- A stated estimate of usage or configuration on which a price is based
Practice problems
Work each problem on paper first, then reveal the answer to check.
Why should each service in an estimate carry a description?
Show answer
So that the assumptions behind the numbers can be checked against the real bill later.
Does the public Pricing Calculator include taxes?
Show answer
No; estimates are shown before tax.
Which tool would you use to estimate a planned workload before building it?
Show answer
The AWS Pricing Calculator.
Give one reason a bill might differ from the estimate.
Show answer
Actual usage differs from the assumptions, the configuration changes, or prices change.
Lesson quiz · 5 questions
Score 60% or more to complete this lesson.
Create a free account to save your progress, take quizzes and earn a certificate.